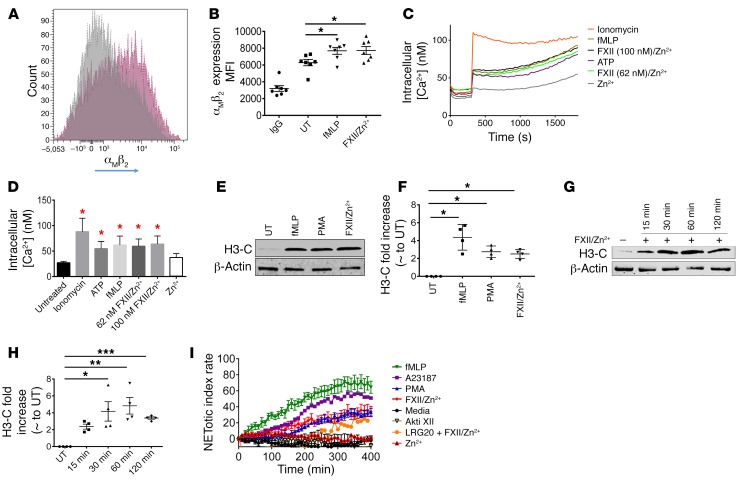
Figure 9. FXII signaling in neutrophils regulates αMβ2 surface expression, intracellular Ca2+ mobilization, and NET formation.
(A) Surface expression of αMβ2 integrin on UT (grey curve) and FXII/Zn2+–stimulated (pink curve) neutrophils. Representative flow diagram of n = 7 individual experiments. (B) Quantitation of αMβ2 antibody binding (mean fluorescent intensity [MFI]). Mean ± SEM, n = 7 experiments. *P < 0.03 UT vs. FXII/Zn2+, 1-way ANOVA. (C) WT neutrophils were loaded with 1 μM Fluro-4-AM Ca2+ dye for 45 minutes and then treated with or without 5 mM ATP, 3 μM ionomycin, 10 μM fMLP, FXII (62 nM or 100 nM)/10 μM Zn2+, or Zn2+ alone. Intracellular Ca2+ mobilization was measured at 30-second intervals for 30 minutes. (D) Intracellular Ca2+ concentration with various agonists. Mean ± SEM, n = 4, each run in triplicate. *P < 0.0001 vs. UT cells, 1-way ANOVA. (E) WT neutrophils were stimulated with fMLP, 100 nM PMA, or FXII/Zn2+ for 120 minutes, and immunoblot analysis was performed for H3-C. Representative blot of n = 4. (F) H3-C fold increase compared with UT neutrophils. Mean ± SEM, n = 4. *P < 0.007 UT vs. FXII/Zn2+, 1-way ANOVA. (G) WT neutrophils were stimulated with 62 nM FXII/10 μM Zn2+ for the indicated times. Immunoblot analysis was performed for H3-C. Representative blot of n = 4. (H) H3-C fold increase compared with UT neutrophils. Mean ± SEM, n = 4. *P = 0.007 at 30 minutes; **P < 0.002 at 60 minutes; ***P = 0.03 at 120 minutes vs. UT, 1-way ANOVA. (I) NETotic index rate of WT neutrophils activated with fMLP, 4 μM A23187, 1 μM PMA, FXII/Zn2+, or Zn2+ alone. Where indicated, neutrophils were preincubated with 5 μM Akti XII or 300 μM LRG20 for 30 minutes before stimulation with FXII/ Zn2+. Curves represent mean ± SEM except A23187 (shown as mean). n = 5–9 each run in triplicate. *P < 0.0001 FXII/ Zn2+ vs. media at 150–400 minutes, 2-way ANOVA.

