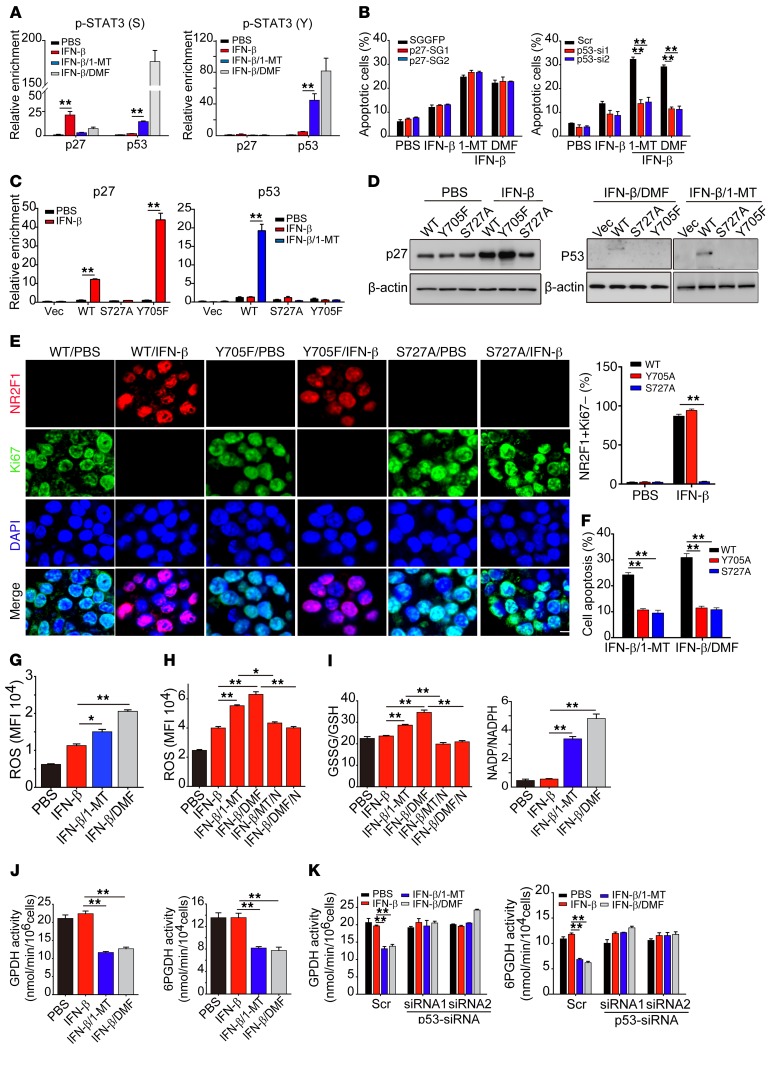
Figure 6. STAT3/p53 pathway regulates IFN-β–induced TRC apoptosis.
(A) B16 TRCs were treated with PBS, IFN-β, IFN-β/1-MT, or IFN-β/DMF for 48 hours. Cells were collected for ChIP-qPCR assay with anti–p-STAT3 (S) (left) or p-STAT3 (Y) (right) and specific primer of p27 or p53. (B) B16-p27-SGGFP and B16-p27-SGs TRCs (left) or scramble-B16 and p53-siRNAs-B16 TRCs (right) were treated with IFN-β, IFN-β/1-MT, or IFN-β/DMF for 24 hours. Cell apoptosis was determined by flow cytometry. (C) STAT3-sgRNA-B16 cells stably expressing Flag-WT-STAT3, Flag-Y705F-STAT3, or Flag-S727A-STAT3 were seeded in 3D fibrin gels and then treated with IFN-β or IFN-β/1-MT. After 48 hours of treatment, Chip-qPCR assay was performed by using anti-Flag antibody with specific primer for p27 or p53. (D and E) B16 TRCs stably overexpressing Flag-WT-STAT3, Flag-Y705F-STAT3, or Flag-S727A-STAT3 were treated with PBS, IFN-β, IFN-β/1-MT, or IFN-β/DMF for 48 or 72 hours. Cell lysates (48 hours) were extracted for Western blot (D) or (72 hours) were fixed and immunostained with anti-NR2F1 and Ki67 antibodies (E) Scale bar: 10 μm. (F) As in (D), but cell apoptosis was determined by flow cytometry. (G–I) B16 TRCs were treated with PBS, IFN-β, IFN-β/1-MT, IFN-β/DMF, IFN-β/1-MT/NAC (10 mM), or IFN-β/DMF/NAC for 48 hours. ROS levels were determined by flow cytometry (G and H). Levels of GSH, GSSG, NADP, or NADPH were measured and the ratio of GSSG/GSH or NADP/NADPH was calculated (I). (J) Activity of GPDH and 6PGDH in B16 TRCs treated with PBS, IFN-β, IFN-β/1-MT, or IFN-β/DMF for 48 hours. (K) B16 TRCs were transfected with p53-siRNA for 24 hours and then treated with IFN-β, IFN-β/1-MT, or IFN-β/DMF for 48 hours. The activity of GPDH and 6PGDH was measured. Graphs represent mean ± SEM of 3 independent experiments. *P < 0.05; **P < 0.01, by 1-way ANOVA (A–C and E–K).

