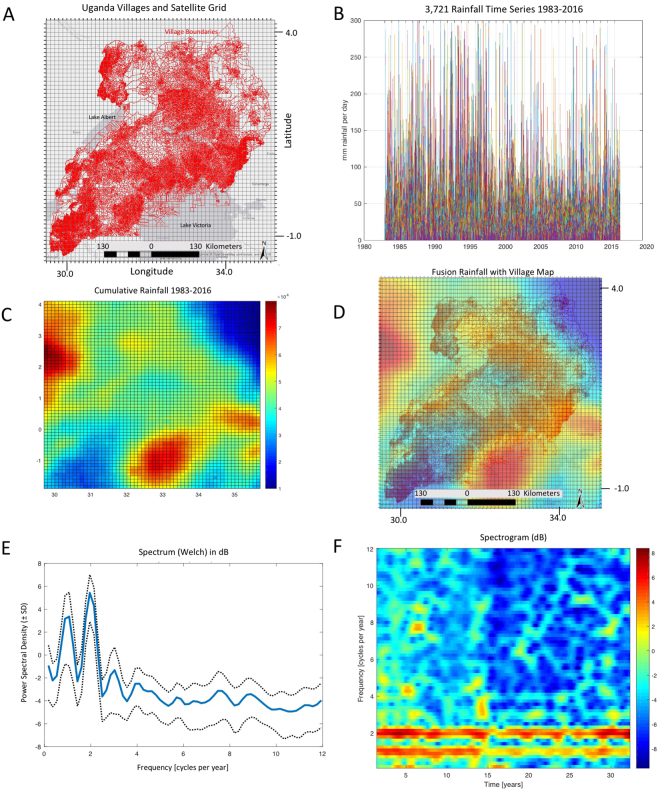
Figure 1.
Fusion of satellite rainfall data with map of Uganda at the village level. Shown are the pattern of cumulative rainfall over the 34-year dataset, and the frequency content of the rainfall demonstrating twice-yearly rainy seasons. (A) Satellite grid overlay over Uganda showing the 44,034 villages as polygons, overlain with the 61 × 61, 0.1° × 0.1°, satellite grid (map created using ArcGIS 10.4.1, http://support.esri.com/Products/Desktop/ArcGIS-desktop/arcmap/10-4-1). Darker grey regions represent water bodies (Lake Albert upper left, and Lake Victoria lower right). (B) Rainfall per day from each of 3,721 grid locations for 12,340 days. Abscissa labeled in years. (C) Cumulative rainfall (in mm in colorbar) on 61 × 61 grid for all 12,419 days over 34 years from 1983–2016. Map created using ArcGIS 10.4.1, http://support.esri.com/Products/Desktop/ArcGIS-desktop/arcmap/10-4-1. (D) Fusion of cumulative rainfall with village and country map. Note that the heaviest rains are over the rainforest within the Congo River Basin to the west of Uganda, and where the northeast corner of Lake Victoria abuts the Ugandan land mass. The driest region is in northeast Uganda, where the Karamoja district abuts northwest Kenya and South Sudan. (E) Spectral density using Welch’s method in decibels (dB) estimated from each of 3,721 grid locations over 12,419 days, with mean and ± 1 SD. Hamming window of 3 × 365 with 95% overlap. Points plotted as decibels (10log10). (F) Spectrogram with mean removed from signal. Note the dominant rainy cycles at 1× and 2× per year.

