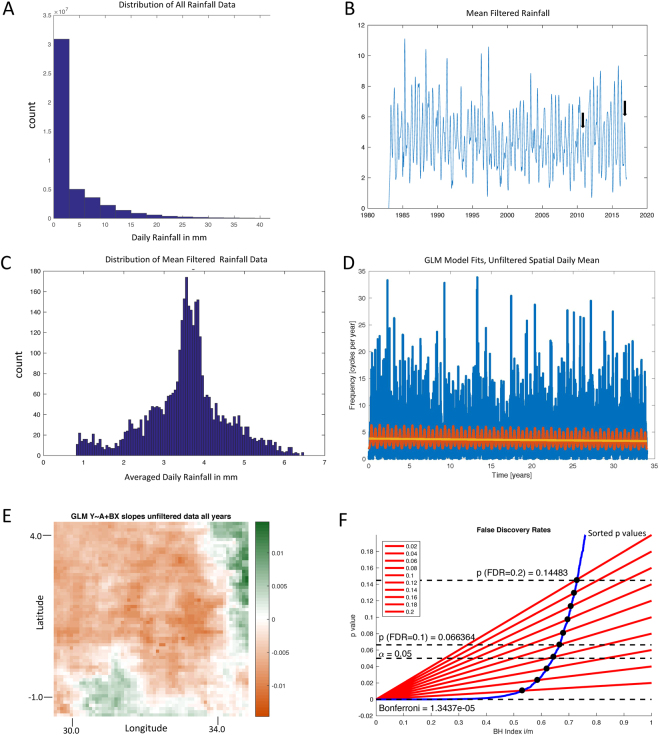
Figure 2.
Spatially averaged rainfall demonstrates a decrease over the 34 year record. The nature of the data with and without spatial averaging is shown, and the origin of the average decrease in rainfall explained by the geographical distribution of decreases and increases in rainfall. (A) Histogram of daily rainfall for all days and locations, truncated below 40 mm rain per day. (B) Daily rainfall spatially averaged, and filtered with finite impulse response filter (order 100) for frequencies 0.05–6 cycles per year. Filter applied with zero phase filtering forwards and backwards. The twice-yearly rainy seasons in the East African Highlands are now plainly seen. Two drought anomalies from droughts in fall rainy season failures are indicated for 2010 and 2016 with black arrows. The averaged and filtered data set from B demonstrates a much less skewed distribution in (C). (D) Linear GLM fit, log(μ) = A + BT, shown by yellow line, and full model fitted with 0.25, 0.5, 1, 2, and 4 cycle per year frequencies shown by red line, superimposed on spatially averaged but unfiltered data in D. In E are shown the individual slopes of linear GLM regression to each grid point time series, with no averaging, on a scale illustrating the intensity of the negative (brown) or positive (green) slopes. Map created using ArcGIS 10.4.1, http://support.esri.com/Products/Desktop/ArcGIS-desktop/arcmap/10-4-1. (F) False Discovery Rate (FDR) plot for the GLM fit p-values from the slope plot in E, for a family of FDR values. The intersections of the sorted p-values (blue) with the Benjamini-Hochberg coefficients (red lines) form the FDR thresholds employed in Fig. 3.

