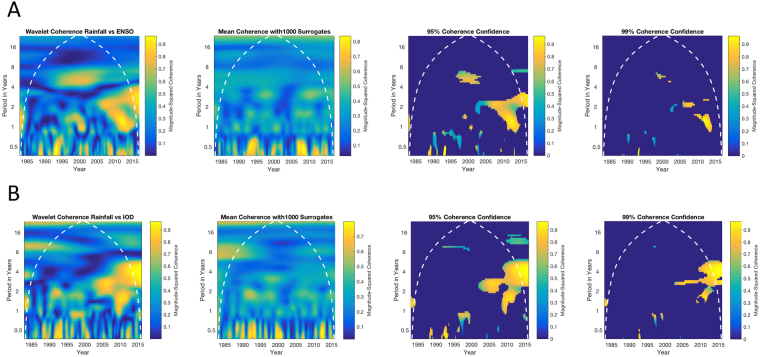
Figure 5.
El Nino Southern Oscillation (ENSO) and Indian Ocean Dipole (IOD) relationship to spatially averaged rainfall. With rigorous statistical confidence bounds, there is a coherency between these indices and the Ugandan rainfall, but only in recent years, and only for relatively short periods from 1–4 years. (A) Wavelet coherency between spatially averaged and filtered rainfall, with the ENSO index interpolated from monthly to daily values, and filtered identically as rainfall data. The second panel reflects the mean of 1000 surrogate coherency calculations, from which 95% (third panel) and 99% (fourth panel) confidence limits reveal only the regions that met these significance criteria. The cone of influence, delimiting where edge effects substantially confound the analysis, is indicated by the white dotted line. (B) Identical calculations for the IOD index. The most significant coherencies between ENSO and IOD occurs during the most recent 10 years, with periods from 1–4 years.

