Figure 1.
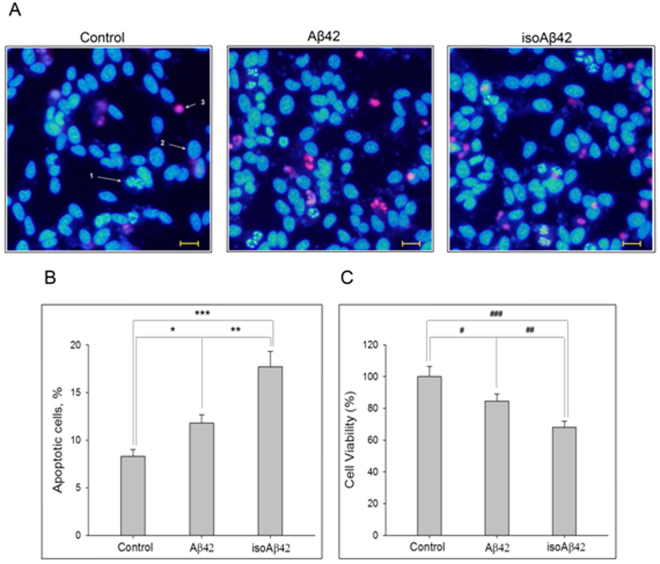
Effects of Aβ42 and isoAβ42 (10 µM) on SH-SY5Y cells. (A) Visualization of the cells using fluorescent microscopy. Left, untreated cells. Centre, cells treated with Aβ42. Right, cells treated with isoAβ42. Arrows indicate the following: 1 - apoptotic cells stained with Hoechst 33342; 2 - living cells; 3 - necrotic cells stained with propidium iodide. Scale is 20 µm. (B) Number of apoptotic cells in the cell population. Control - untreated cells; isoAβ42 and Aβ42 - cells treated with isoAβ42 and Aβ42 for 24 h, respectively. (C) Viability of the cells in percent, revealed by MTT-test treated with Aβ42 or isoAβ42 relative to control without treatment at 48 h. Each value represents mean ± SD of at least three independent experiments performed in quadruplicate; *p < 0.023, **p < 0.002, ***p < 0.001, #p < 0.005, ##p < 0.003, ###p < 0.001.

