Fig. 6.
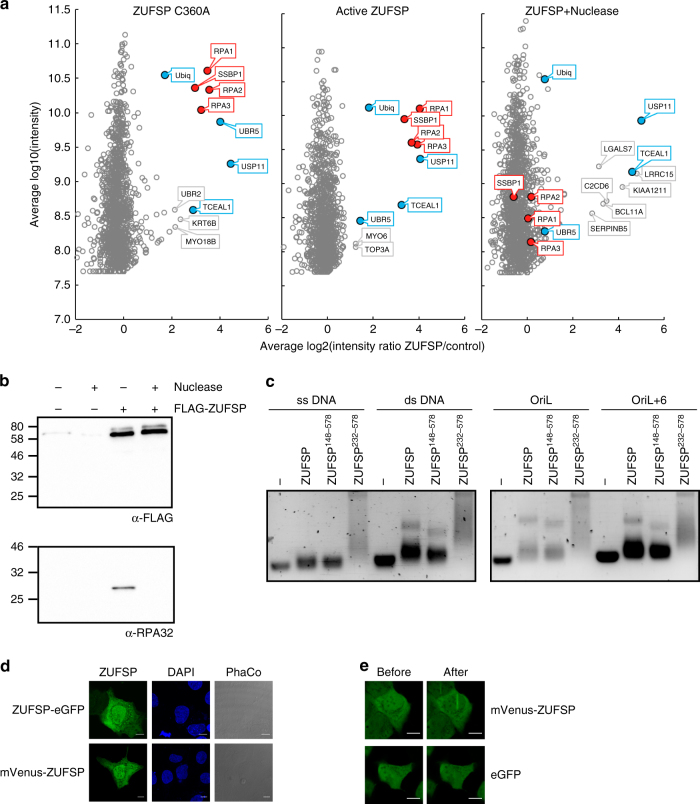
ZUFSP localization and interaction network. a FLAG-tagged versions of inactive ZUFSPC360A (left) and active ZUFSP (middle, right) were expressed in HEK293T cells and co-precipitating proteins quantified by mass spectrometry. Log2 enrichment ratios relative to uninduced/untransfected controls are plotted against log10 signal intensity. The right panel shows the results after nuclease treatment. Consistently enriched proteins are labeled in color, red for DNA-dependent and blue for DNA-independent enrichment. The bait ZUFSP is off-scale and hence not shown; the x/y coordinates are 9.7/11.1 (left), 11.0/11.2 (middle), and 10.5/11.6 (right panel). b FLAG-tagged ZUFSP was immunoprecipitated from HEK293T cells in the presence or absence of nuclease. Coimmunoprecipitated endogenous RPA32 was visualized with α-RPA32 4E4. c Electrophoretic mobility shift assay (EMSA) comparing the DNA-binding preferences of the full-length ZUFSP to the N-terminal truncations (ZUFSP148–578 and ZUFSP232–578). All constructs were tested against a panel of oligonucleotides previously tested for SSBP1 binding28, including ssDNA, dsDNA, short hairpin (OriL), and long hairpin (OriL+6). d Localization of ZUFSP N-terminally fused to mVenus or C-terminal fused to eGFP (green) was visualized in fixed U2OS cells. Cells are shown in phase contrast (PhaCo) and nuclei are stained with DAPI (blue). Scale bar = 10 µm. e Localization of mVenus-tagged ZUFSP to sites of NIR laser-induced DNA damage in U2OS cells (top panels), as compared to eGFP alone (bottom panels). Images were taken immediately before (left) and 10 s after 800 nm laser irradiation (right). Scale bar = 10 µm

