Figure 2.
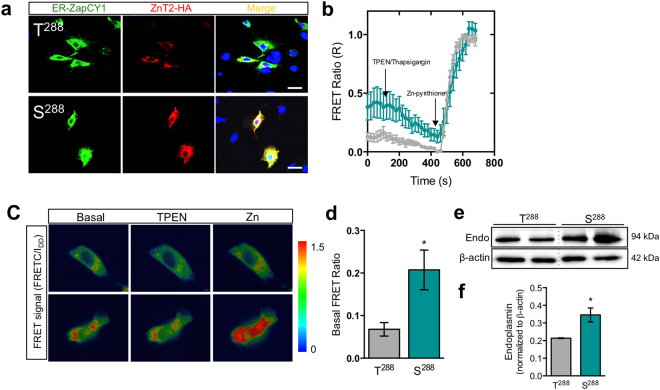
Ectopic expression of the S288 variant of ZnT2 is retained in the ER, accumulates Zn in ER, and induces ER stress. (a) Representative confocal images of ER-ZAPCY1 (green) and ZnT2-HA (red) in MECs transfected to express wild-type ZnT2 (T288) and the ZnT2 variant (S288). Merged images (yellow) illustrate co-localization of ER-ZAPCY1 and ZnT2. Nuclei were counterstained with DAPI (blue). Note robust co-localization of ER-ZAPCY1 and ZnT2-HA in MECs expressing S288 (Pearson’s coefficient = 0.87), indicating ER localization of S288 compared with MECs expressing T288 (Pearson’s coefficient = 0.34; scale bar, 25 µm). (b) Representative FRET analysis demonstrating the changes in FRET ratio (R) of ER-ZAPCY1 in MECs expressing T288 or S288 treated with TPEN (100 µM) and thapsigargin (2 µM; Rmin) followed by zinc pyrithione (100 µM; Rmax), n = 10–14 cells/genotype, from four independent experiments. (c) Representative pseudocolored FRET signal images of ER-ZAPCY1 in MECs expressing T288 or S288 at rest (Basal), after TPEN (100 µM) + thapsigargin (2 µM; TPEN) treatment, in each case followed by zinc pyrithione (100 µM; Zn) treatment (scale bar, 10 µm). (d) Quantification of basal FRET ratio in MECs expressing T288 or S288. Data represent mean FRET ratio at basal levels ± SEM, n = 10–14 cells/genotype, from four independent experiments; p < 0.05*. (e) Representative immunoblot of endoplasmin (Endo) in total lysates from MECs expressing T288 or S288 treated with Zn. β-actin served as a loading control. Dotted lines indicate spliced sections obtained from a single blot; representative samples (n = 2/group) were selected for publication. Spliced blots are displayed and full-length blots can be found in Supplementary Fig. S3a,b. (f) Quantification of endoplasmin expression. Data represent mean endoplasmin expression normalized to β-actin ± SD, n = 6 samples/genotype, from three independent experiments; p < 0.05*.

