Figure 3.
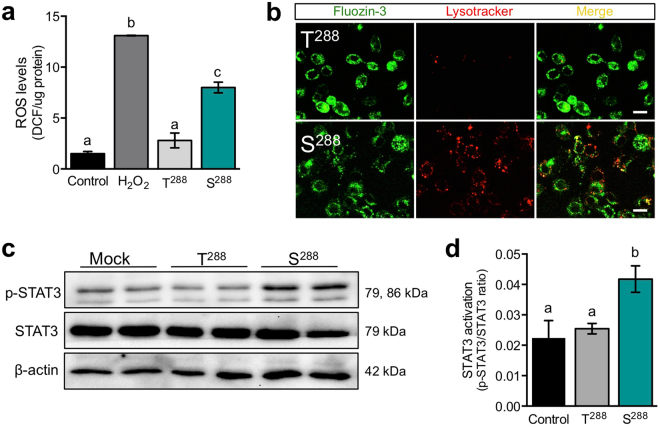
Cells expressing the S288 variant of ZnT2 have increased oxidative stress, lysosomal activity and STAT3 activation. (a) Assessment of reactive oxygen species (ROS) level in untransfected MECs (Control) or MECs transfected to express wild-type ZnT2 (T288) or the ZnT2 variant (S288). Cells treated with H2O2 (100 µM) were used as a positive control. Data represent mean DCF-HA fluorescence/µg of protein ± SD, from n = 6 samples/group; the experiment was repeated three times. Means with different letters are significantly different, p < 0.01. (b) Representative confocal images of FluoZin-3 (green) and Lysotracker Red (red) in MECs expressing T288 or S288. Merged images (yellow) illustrate co-localized FluoZin-3 and Lysotracker Red. Note greater Lysotracker Red fluorescence in MECs expressing T288 compared with MECs expressing S288 (scale bar, 20 µm). (c) Representative immunoblots of p-STAT3 and total STAT3 in cell lysates from MECs expressing T288, S288, or mock-transfected (Mock) cells. β-actin served as a loading control. Cropped blots are displayed and full-length blots can be found in Supplementary Fig. S4a–c. (d) Quantification of STAT3 activation. Data represent mean p-STAT3/total STAT3 ± SD from n = 6 samples/genotype, from three independent experiments. Means with different letters are significantly different, p < 0.05.

