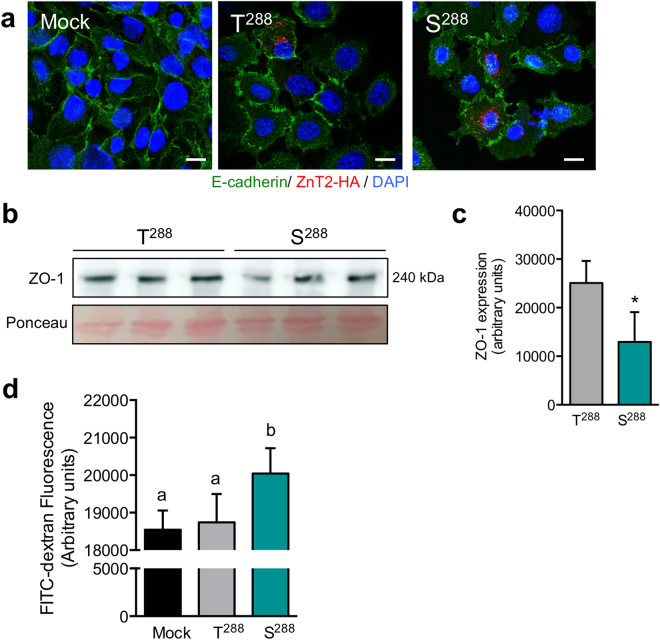
Figure 4.
Barrier function is disrupted in MECs expressing the S288 variant of ZnT2. (a) Representative confocal images of E-cadherin (green) and ZnT2-HA (red) in MECs transfected to express wild-type ZnT2 (T288) or the ZnT2 variant (S288). Nuclei were counterstained with DAPI (blue; scale bar, 10 µm). (b) Representative immunoblot of zonula occludens-1 (ZO-1) in total cell lysates from MECs expressing T288 or S288. Ponceau staining served as a loading control. Cropped blots are displayed and full-length blots can be found in Supplementary Fig. S5a,b. (c) Quantification of ZO-1 expression. Data represent mean ZO-1 signal intensity ± SD from n = 3 samples/genotype; p < 0.05*. (d) Assessment of barrier function in cells expressing T288 and S288. Data represent mean FITC-dextran fluorescence (arbitrary units) ± SD, from n = 3 samples/genotype; the experiment was repeated two times. Mock represents mock-transfected MECs. Means with different letters are significantly different, p < 0.05.

