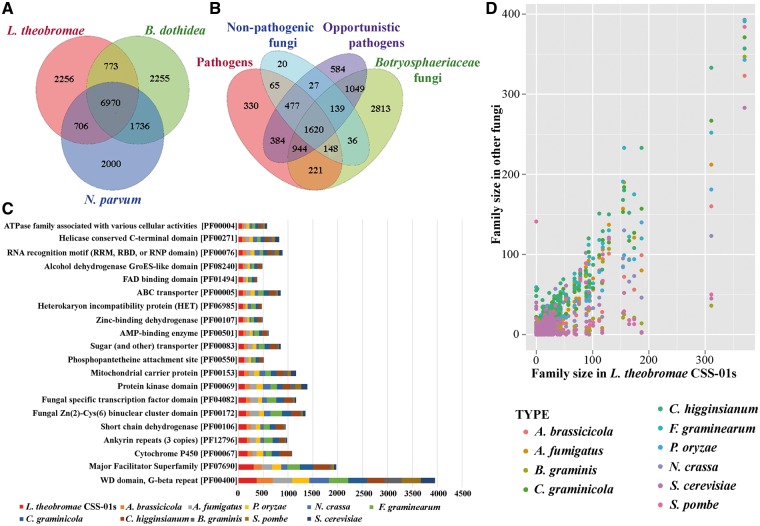
Figure 2.
Overview of the gene family size comparison between the L. theobromae (CSS-01s) and other fungi. (A and B) Venn diagram of predicted gene families in (A) L. theobromae, B. dothidea and N. parvum and (B) Botryosphaeriaceae family with other fungi. The values explain the union counts of orthologous gene families shared among different fungi groups. Botryosphaeriaceae taxa share the highest number of unique gene families with opportunistic pathogens. (C) Top 20 Pfam domains in L. theobromae CSS-01s genome, compared with those in other fungi used in the comparative analysis. (D) Pair-wise comparison of Pfam gene family sizes between L. theobromae CSS-01s and other fungi used in the comparative analysis.

