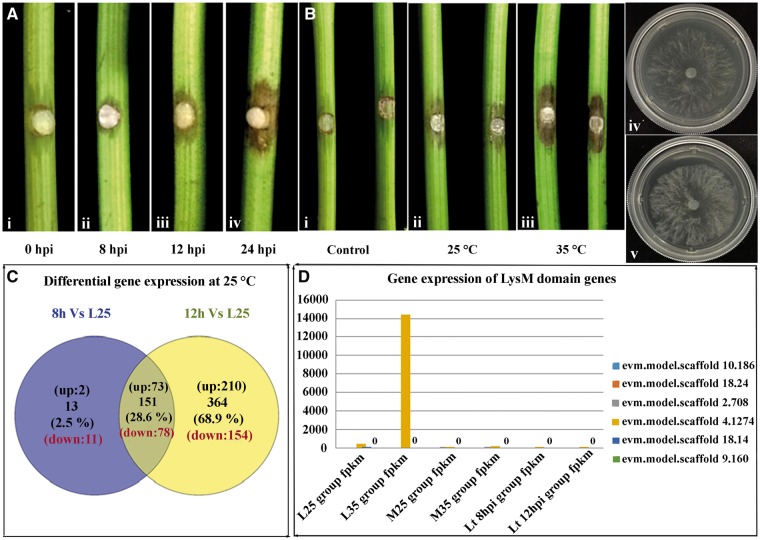
Figure 3.
Difference in the virulence of Lasiodiplodia theobromae and their gene expression at different stages of growth and at different temperatures. (A) Difference in the virulence of L. theobromae at different infection stages on grape shoots. Figure shows the progress of infection of L. theobromae isolate CSS-01s at (i) 8, (ii) 12 and (iii) 24 hpi. (B) Differences in the virulence of L. theobromae isolate CSS-01s at different temperatures on grape shoots and their growth differences on the axenic cultures at respective temperatures: (i) control test with PDA without inoculum, (ii) virulence at 25 °C (iii) virulence at 35 °C, (iv) axenic culture growth at 25 °C and (v) culture growth at 35 °C. (C) Venn diagram showing in planta differentially expressed genes of L. theobromae at different time points after inoculation. Numbers indicate differentially expressed genes that are specific to each time point, or shared by two different time points. Differentially expressed genes at 8 and 12 hpi are represented with circles. (D) Up-regulation of LysM domain genes of L. theobromae during transcriptome analysis. L indicates samples collected from axenic cultures, M indicates samples of fungus and host tissues. Two different temperatures of 25 °C and 35 °C indicated by numbers 25 and 35. Two sample collection time points were indicated by 8 and 12 hpi.

