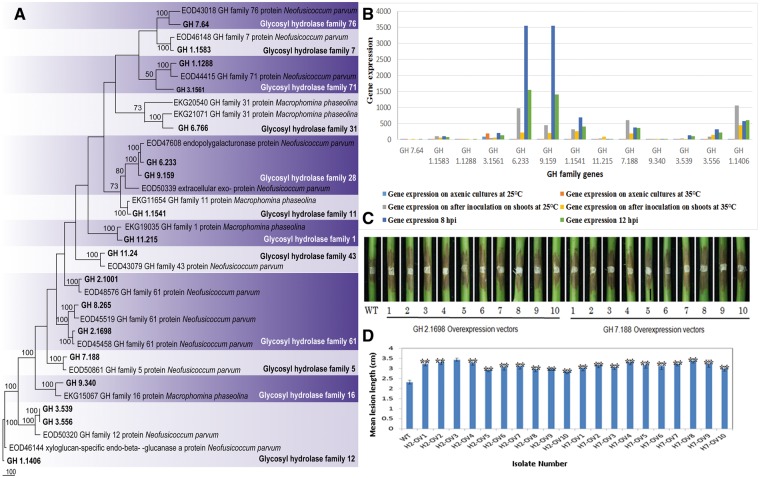
Figure 6.
Phylogentic analyses, gene expression and pathogenicity assays conducted for glycosyl hydrolase family genes. (A) One of the 1000 most parsimonious trees obtained from a heuristic search of glycosyl hydrolase family genes and 36 related sequences from closely related species. Parsimony bootstrap support values ≥ 50% are indicated at the nodes and branches and the sequences from this study are given in bold. (B) Gene expression analysis of selected glycosyl hydrolase family genes. This includes the gene expression at different conditions (on axenic cultures and on grape shoots after inoculation at 25 °C and at 35 °C) and at different infection stages (8 and 12 hpi). (C) Lesions on stems were photographed at 3 days post-inoculation of the above L. theobromae transformants. WT indicates the wild-type strain of L. theobromae CSS-01s and numbers 1–10 represent the replicates of each overexpressing transformants conducted for each gene. First 10 stems were inoculated with the GH 2.1698 overexpressing transformants of L. theobromae, and the second 10 stems were inoculated with the GH 7.188 overexpressing transformants of L. theobromae. (D) Bar chart showing the mean lesion lengths of the overexpressing transformants. WT indicates the wild-type strain of L. theobromae CSS-01s. H2-OV1–H2-OV10 represents the mean lesion lengths of the GH 2.1698 overexpressing transformants of L. theobromae, and H7-OV1–H7-OV10 represents the GH 7.188 overexpressing transformants of L. theobromae.

