Fig. 1.
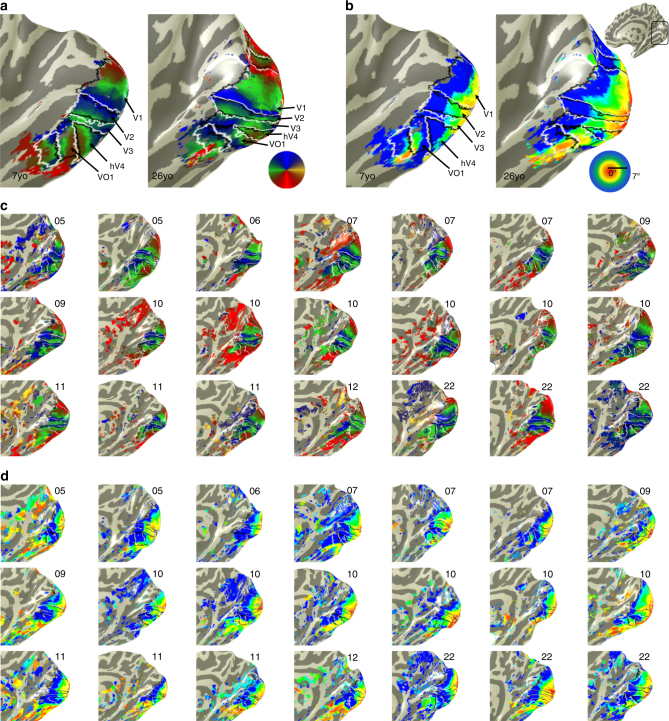
Early visual areas show no qualitative development. a Polar angle maps from an example 7-year-old and 26-year-old. Color wheel: polar angle. Data are shown within an anatomical mask encompassing the central 7°. b Eccentricity maps in the same participants. Color wheel: eccentricity. Inset brain shows zoomed region in black outline. c Polar angle maps and d eccentricity maps in the right hemisphere of all child participants and three example adults. Numbers indicate the age of the participant. Maps are of the central 7° and are thresholded at 5% variance explained, voxel level. Lines: boundaries of visual field maps. Polar angle and eccentricity maps of all participants and both hemispheres are shown in Supplementary Figures 3–6

