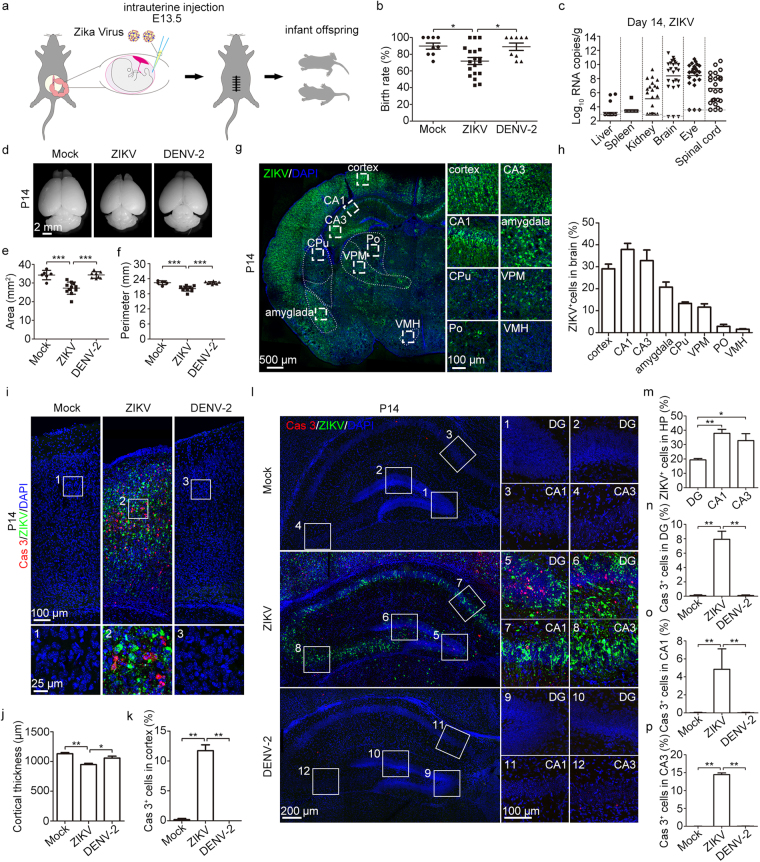
Figure 1.
Low birth rate, high mortality and severe brain pathology induced by intrauterine ZIKV inoculation. (a) Schematic depiction of intrauterine inoculation during pregnancy. Offspring mice were used in following studies. (b) Birth rate of neonatal mice. (c) ZIKV viral load in P14 tissues was measured by qRT-PCR. Bars indicate the mean. The gray dashed lines indicate the limit of detection. (d) Representative images of brains from P14 offspring. (e,f) Area (e) and perimeter (f) of the hemiencephalon of P14 mice. (g) Overview of ZIKV infection in 1 representative brain slice. CPu, caudate putamen (striatum); Po, posterior thalamic nuclear group; VPM, ventral posteromedial thalamic nucleus; VMH, ventromedial hypothalamic nucleus. (h) Percentage of ZIKV-infected cells in different brain regions. n = 5 samples from three independent experiments. (i) Representative images of the cortex stained for Cas3 (Caspase 3) and ZIKV. (j) Quantification of cortical thickness. (k) Percentage of Cas3-positive cells within the cortex. (j,k) n = 5 samples from three independent experiments. (l) Representative images of the hippocampus stained for Cas3 and ZIKV. (m) Percentage of ZIKV-infected cells in the DG, CA1, and CA3. n = 5 samples from three independent experiments. (n–p) Percentage of Cas3-positive cells within the DG(n), CA1(o), and CA3(p), respectively. nMock = 4, nZIKV = 5, nDENV-2 = 4 samples from three independent experiments. Quantification data are presented as the mean ± SEM. One-way ANOVA with Bonferroni’s post hoc test (*p < 0.05, **p < 0.01, ***p < 0.001).

