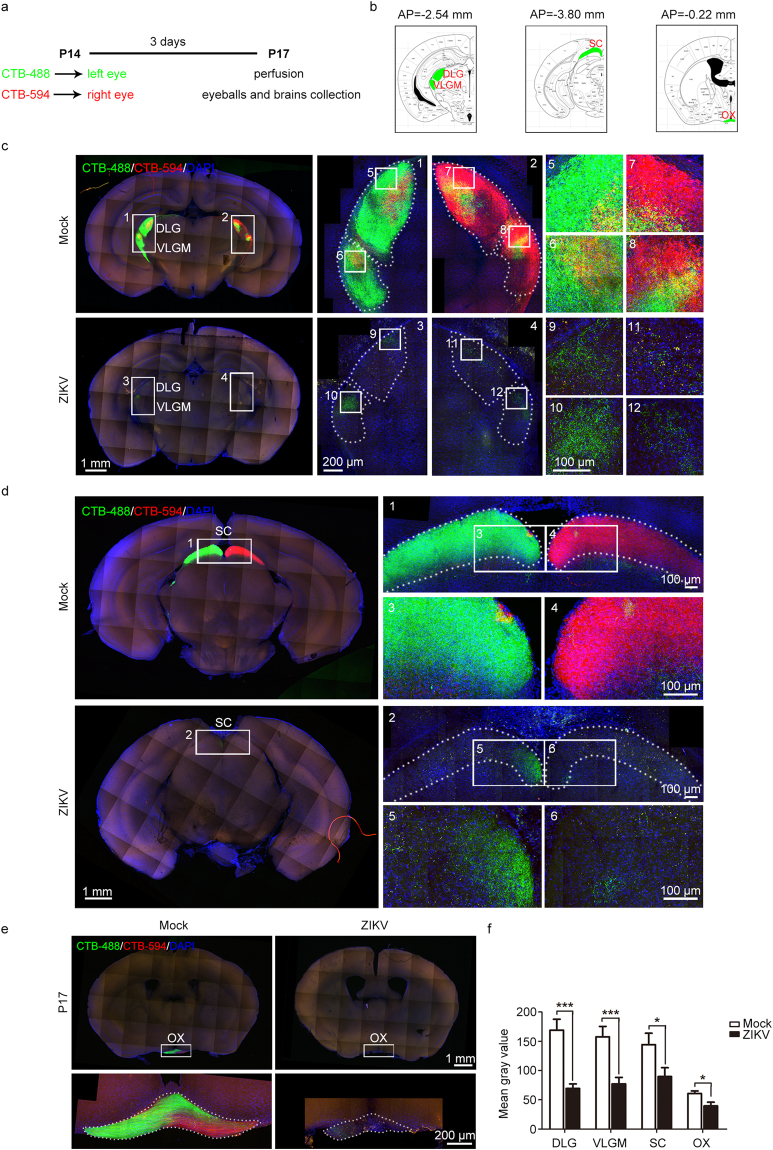
Figure 4.
Impaired visual projection was induced by maternal ZIKV infection. (a) Schematic depiction of the anterograde tracing method used. (b) Brain atlases indicate the sites of brain slices in (c), (d), and (e), respectively. (c–e) Results of visual projection in the LGN (c), SC (d), and OX (e), respectively. (f) Mean gray value of visual projection fibers in the DLG, VLGM, SC, and OX. DLG and VLGM: nMock = 10, nZIKV = 14 samples; SC: nMock = 11, nZIKV = 10 samples; OX: nMock = 11, nZIKV = 9 samples from three independent experiments. Data are presented as the mean ± SEM. Student’s t-test, *p < 0.05, ***p < 0.001.

