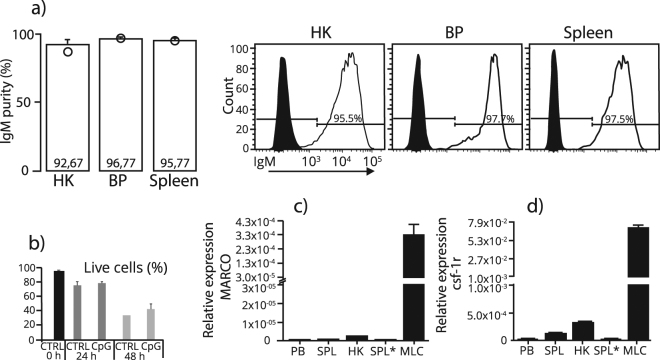
Figure 2.
Purity and viability of IgM+ B cells sorted by magnetic activated cell sorting (MACS). (a) Upon sorting, the mean percentages of IgM+ cells from HK, PB and spleen (n = 3 for each tissue) were analysed by flow cytometry. The circle (○) represents total percentage of viable cells before gating for IgM+ events. Histogram represents one representative individual for each tissue, where IgM+ events are presented by the transparent peak and non-stained events by the black peak. (b) Viability of IgM+ cells kept in culture with or without CpG for 0, 12 and 24 hours. (c and d) The relative expression of MARCO and csf-1r in MACS and FACS sorted IgM+ cells, and in macrophage-like cells (MLC).

