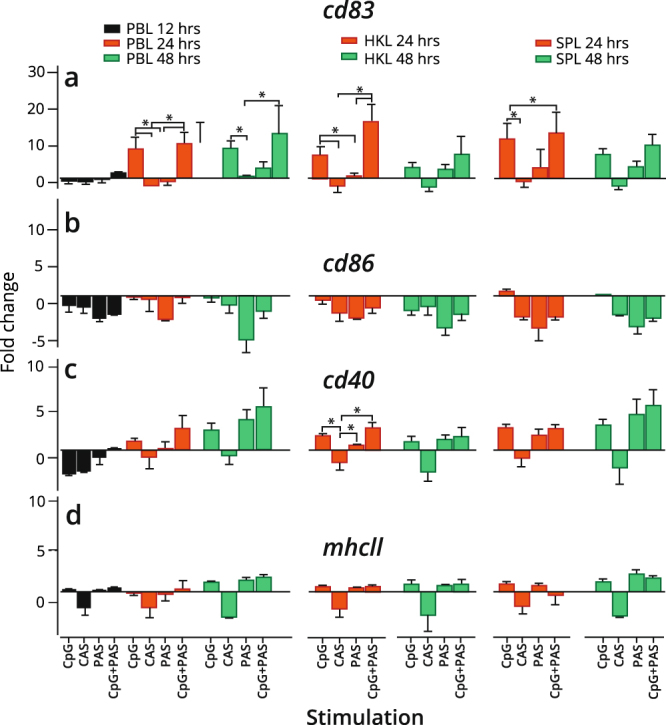
Figure 5.

Expression of APC marker and co-stimulatory genes in IgM+ B cells treated with CpG and/or condition supernatants. IgM+ B cells from Atlantic salmon peripheral blood (PB), head kidney (HK) and spleen leukocytes were MACS purified, stimulated in vitro or left untreated and analyzed by RT-qPCR for expression of (a) cd83, (b) cd86, (c) cd40 and (d) mhcII. Gene expression data at each time point were normalized against the endogenous control gene EF1aB and fold changes were calculated using the unstimulated sample at the same time point74. Data represent mean ± s.e.m from at least three individuals (n = 3 to 6). The line intersecting the y-axis at 1 represents the unstimulated control that the fold change of the treatments are in relation to. Significant fold changes (p < 0.05) are indicated by *. CAS; Control adherent cell supernatant, PAS; Pulse adherent cell supernatant.
