
Figure 3.
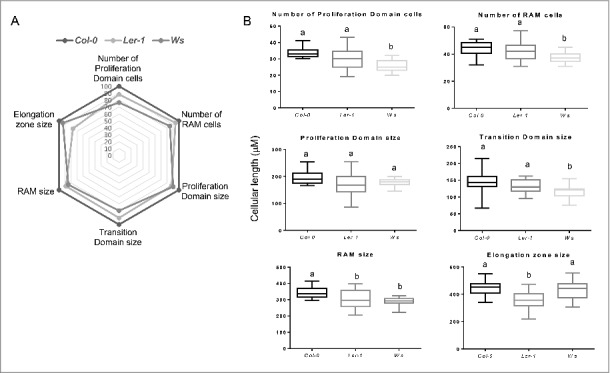
Analysis of different cell parameters along the primary root of the Col-0, Ler and Ws Arabidopsis thaliana ecotypes. (A) Spider graphical model analysis of different cellular quantifications of the three Col-0, Ler and Ws ecotypes. The values represents ratio indicators taking Col-0 as the reference (100%), in all the parameters. B) Box plot from each of the measured parameters, the letters show the significant differences with a confidence interval ≥ 95% for Col-0, Ler and Ws ecotypes.