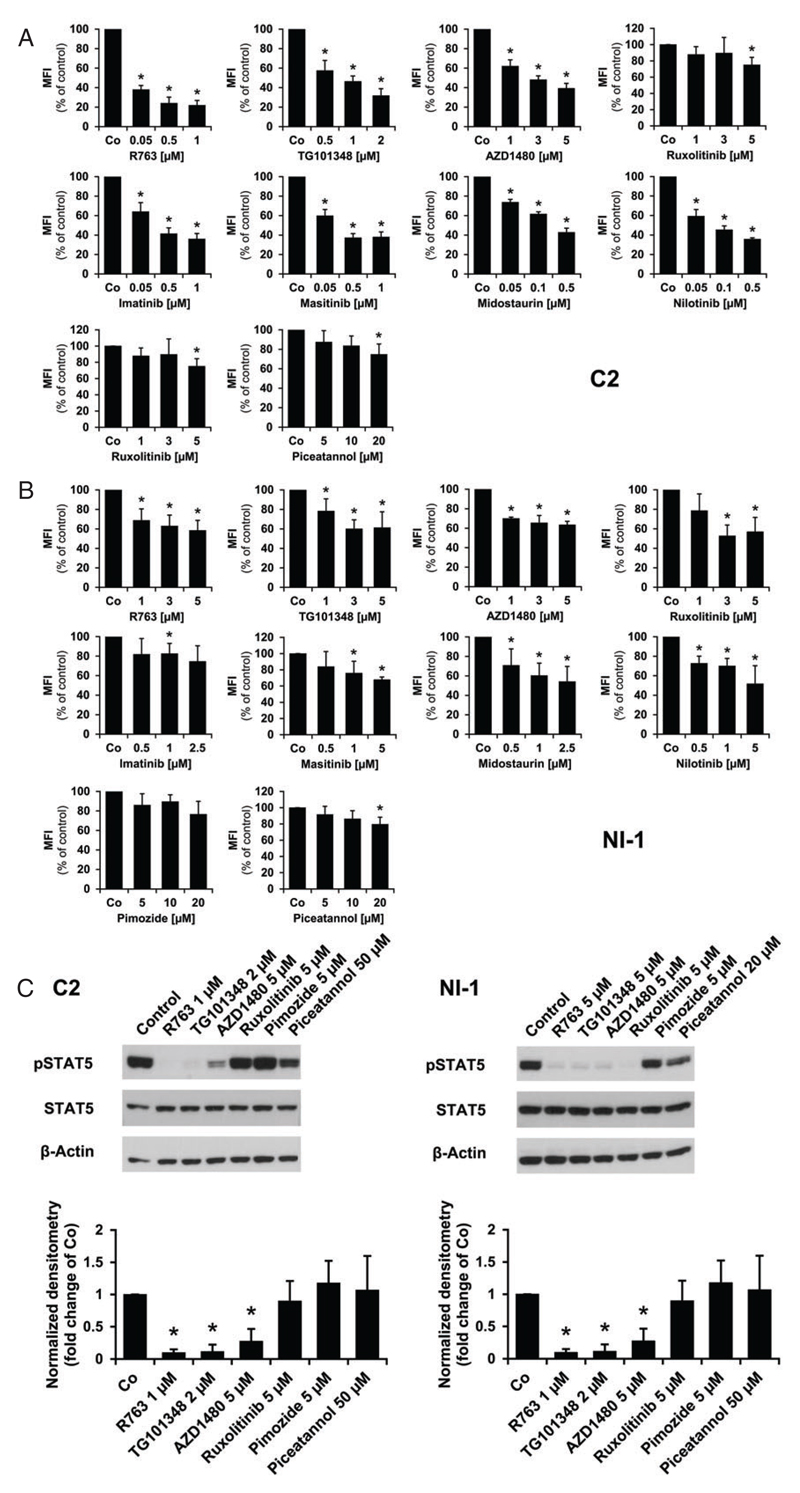
Figure 2.
Effects of targeted drugs on pSTAT5 expression in C2 and NI-1 cells. C2 (A) and NI-1 cells (B) were incubated in control medium (Co) or in medium containing various drug concentrations (as indicated) at 37°C for 4 hours. pSTAT5 levels were analyzed using flow cytometry and an Alexa Fluor 647-conjugated anti-pSTAT5 antibody. The staining technique is described in the text. Results show the mean fluorescence intensity (MFI) values relative to medium control (100%) and represent the mean ± SD of at least 3 independent experiments. Asterisk: P < 0.05. The medium control and dimethyl sulfoxide (DMSO) control (not shown) produced almost identical results. C, C2 (left panel) and NI-1 (right panel) cells were exposed to various inhibitors for 4 hours and levels of phosphorylated STAT5 and total STAT5 were examined using Western blotting as described in the text (upper panel). β-Actin served as loading control. The levels of pSTAT5 were quantified by densitometry and normalized to β-Actin (lower panel). Results are expressed relative to control (=1.0) and represent the mean ± SD of 3 independent experiments. *P < 0.05.

