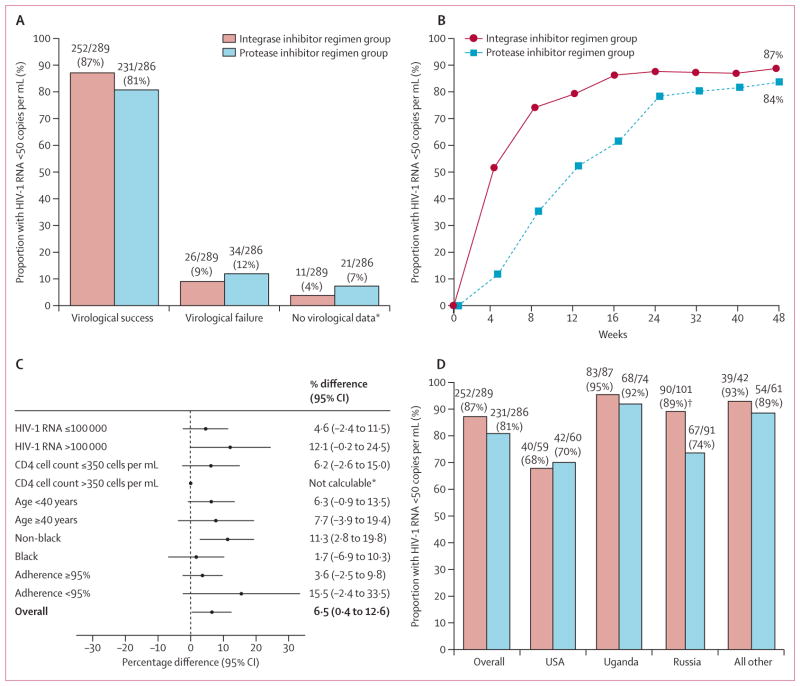
Figure 2. Efficacy data up to week 48.
(A) Proportion of participants who were responders (HIV-1 RNA viral load of less than 50 copies per mL at week 48, according to the US Food and Drug Administration snapshot algorithm), had virological failure, or had no virological data. (B) Proportion of participants with HIV-1 RNA load of less than 50 copies per mL according to study visit through to week 48. (C) Difference in response rates in the subgroups from the intention-to-treat population; all comparisons are represented as adjusted differences in proportion (integrase inhibitor regimen minus the protease inhibitor based regimen); 95% CIs calculated after adjustment by baseline HIV-1 RNA and race strata. (D) shows the proportion of participants who are responders by regions by treatment group. *Data not calculable in subgroup CD4 count 350 cells per μL or greater due to imbalance in race and viral load distribution in the subgroup. †Statistical significance (p=0·0072).

