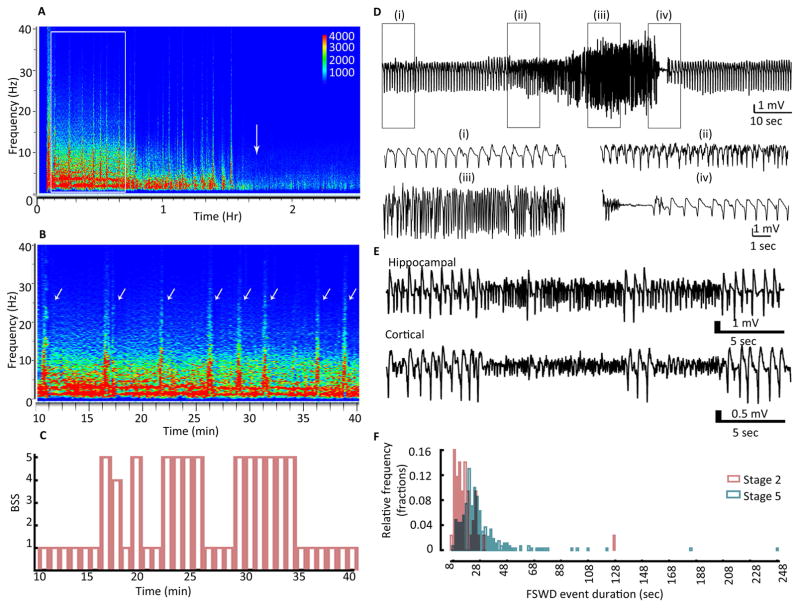
Figure 3. Fast discharges during SE and their correlation with behavioral seizures.
(A) Spectrogram illustrating the power of EEG recorded from the hippocampus during SE in a representative animal. The white arrow marks the end of SE. The white box marks the spectrum that is magnified in panel B. (B) The spectrogram illustrates EEG power during a period of 10 to 40 min following the end of hippocampal stimulation. The power in the 0–10 Hz frequency range was high. Arrows mark the HAFDs/LAFDs. (C) The behavioral seizure score over the 30-min duration corresponding to the spectrogram is illustrated in panel B. Behavioral seizures were scored every minute. The animals were exploratory during SE (stage 1), and the instances of fast discharges correlated with behavior ranging from head bobbing (stage 2) to rearing and falling (stage 5). Time 0 corresponds to 10 min from the end of stimulation. (D) Hippocampal EEG showing a HAFD. Traces below show magnified EEG from boxed regions (i), (ii), (iii), and (iv) demonstrating the baseline activity (i), onset of fast discharge event marked by increase in the frequency (ii), a further increase in the frequency of spike-wave discharges and enhancement of amplitude (iii) and the end of the HAFD marked by suppression of EEG followed by resumption of baseline activity (iv). (E) EEG from hippocampal and cortical electrodes showing a LAFD, characterized by an abrupt increase in the frequency along with suppression of amplitude. (F) Frequency distribution histogram showing the duration of fast discharges accompanied by stage 5 or stage 2 behavioral seizures, N=43 events accompanied by BSS 2 and N=266 events accompanied by BSS 5.

