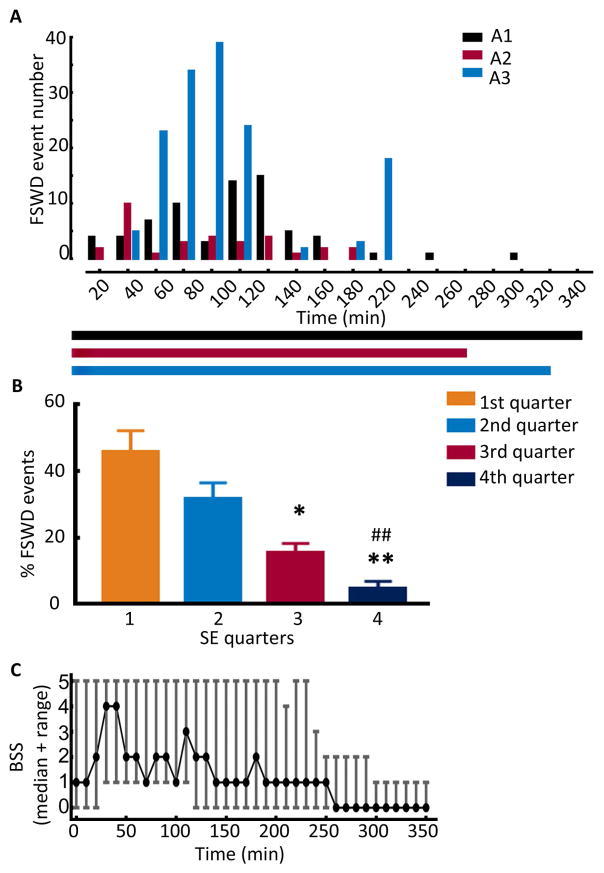
Figure 4. Changes in the characteristics of fast discharges over the course of SE.
(A) The occurrence of fast discharges over the course of SE in 3 representative animals (A1, A2, and A3). The events were counted in 20-min time periods over the entire length of SE. The horizontal bars below the graph show the duration of SE in each animal. (B) The percentage of fast discharges in the four quarters of SE. The events in each quarter of SE were counted and expressed as a percentage of the total number of fast discharges in each animal, N=13, * p<0.05 vs 1st quarter, ** and ## p<0.005 vs 1st and 2nd quarter. (C) Distribution of behavioral seizures over the length of SE, N=13. The graph represents the median BSS along with the range. Seizures were scored over a period of 1 min every 10 min, and time 0 corresponds to the end of hippocampal stimulation.

