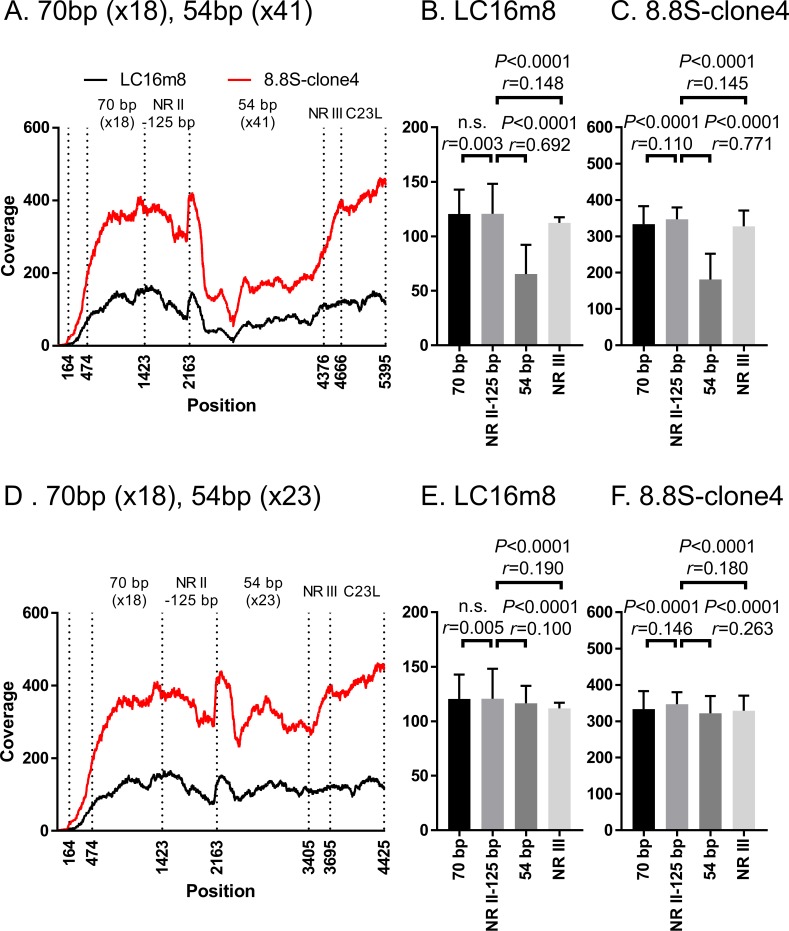
Fig 10. Identity of the ITR region in authentic m8 and 8.8S-clone4, a clone that was plaque-purified from EGFP-negative and bacterial replicon-free vLC16m8.8S-BAC.
The coverage depth computed by the alignment of short-reads to the sequence of the left ITR region, which was extracted from the consensus sequence of pLC16m8.8S-BAC is shown (A and D). The coverage depth in the ITR left region from the terminus (position 1) to the C23L gene of m8 or 8.8S-clone 4 was plotted as either a black or a red line. The mean of the coverage depth by each of the regions (i.e., 70 base pair repeat, non-repeated region II to 125 base pairs, 54 base pair repeat, non-repeated region III, and C23L) was plotted (B, C, E, and F). One-way ANOVA with Bonferroni's multiple-comparison test was used to determine the level of statistical significance. The effect size (r), which indicates the magnitude of the mean difference between the regions, was also calculated. The mean of coverage depth at the 70 base pairs repeats were calculated from position 474 to 1423 to exclude the effect of low coverage depth artificially occurred at the terminus of the reference sequence. The number of 54 base pair tandem repeats in the reference sequence was artificially modified from x 41 (A-C) to x 23 (D-E). “n.s.” indicates "not significant”.

