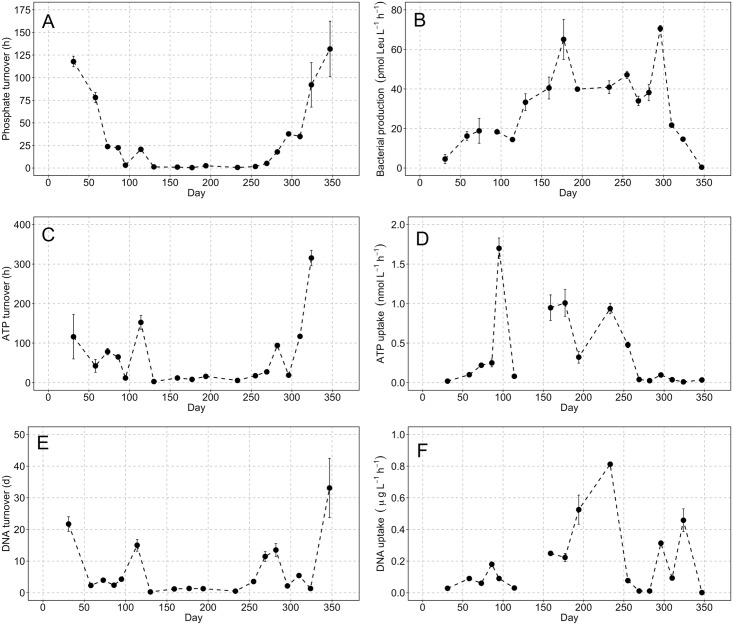
Fig 4. Time-series data of substrate uptake and turnover kinetics.
(A) Inorganic phosphate turnover, (B) ATP turnover, (C) ATP uptake, (e) DNA turnover and (F) DNA uptake. Error bars are computed from the LINEST function of the concentration series bioassay data (Tables 1–3). Panel (B) shows community-level leucine incorporation and is taken as an estimate of bacterial production [77]; error bars are from replicate incubations (n = 3). Grey symbols mark the sampling dates when standard environmental parameters were measured and black symbols mark those where the kinetic bioassay experiments were conducted.

