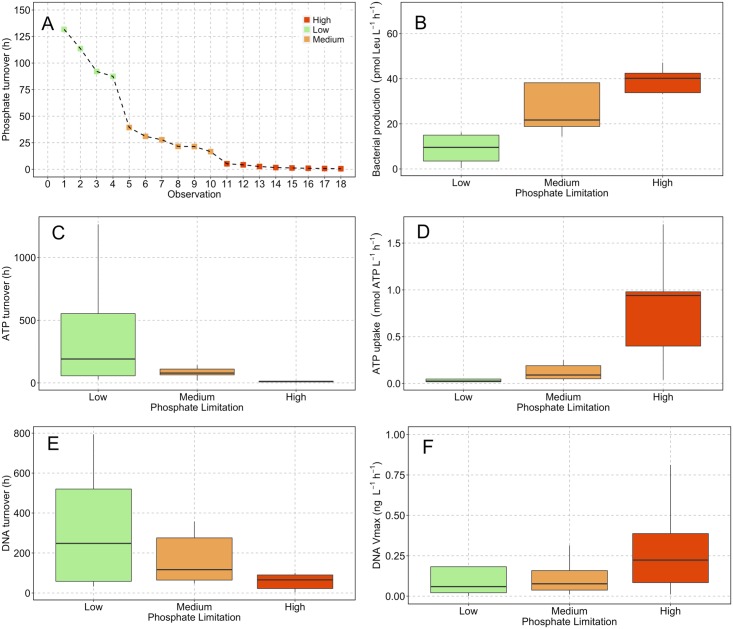
Fig 5. Phosphate limitation categories.
Panel (A) shows the empirically derived phosphate limitation categories. Category limits were defined on the basis of successive values increasing by a factor ≥2 and constrained by ensuring that differences between the mean of each category were statistically significant resulting in three categories; high, medium and low phosphate limitation. Panels (B-F) are box and whisker plots of kinetic uptake within these empirically defined categories. Statistically significant differences between the categories are summarized in Table 4.

