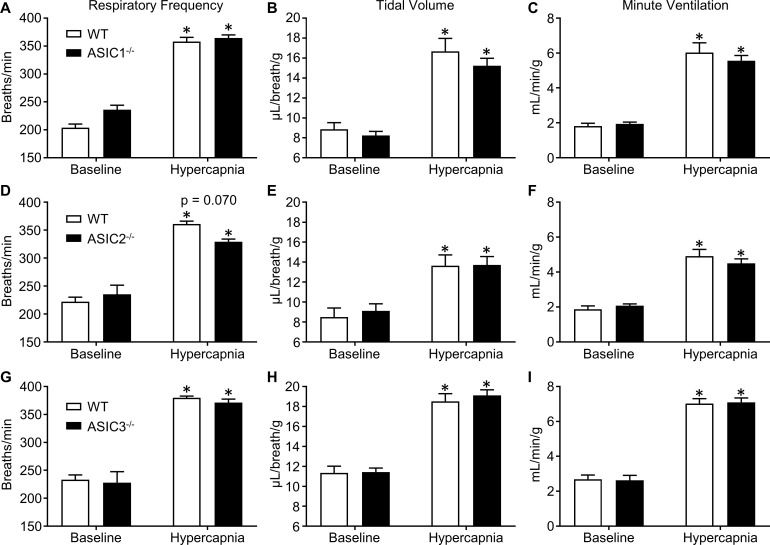
Fig 2. The hypercapnic ventilatory response does not require ASIC1, 2, or 3.
Whole-body plethysmography was used to determine respiratory frequency (breaths/min; A, D, G), tidal volume (μL/breath/g; B, E, H), and minute ventilation (ml/min/g body wt; C, F, I) at baseline and during exposure to hypercapnia (6% CO2) in WT, ASIC1-/- (A-C), ASIC2-/- (D-F), and ASIC3-/- mice (G-I). Values are means ± SE; n = 8 (A-C), 7–8 (D-F), or 11–12 (G-I) animals/group. *P < 0.05 vs. baseline (2-way, repeated measures ANOVA; Sidak’s post-hoc test). Displayed P value corresponds to comparison between WT and KO (panel D).

