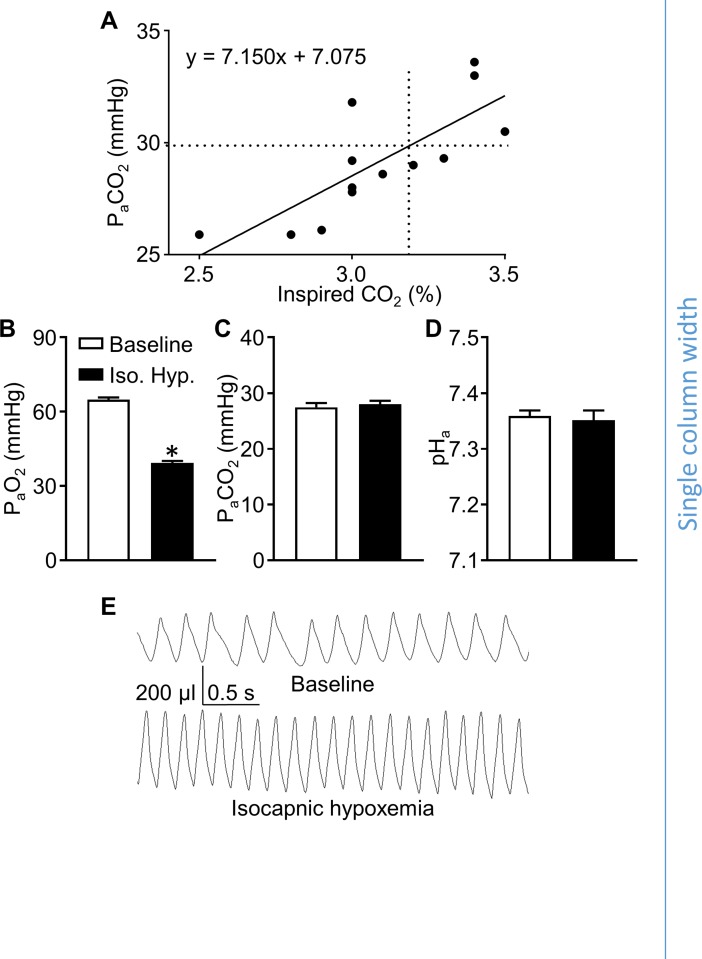
Fig 3. An inspired CO2 of 3.2% causes isocapnic hypoxemia in mice concurrently exposed to 7.0% O2.
A scatter plot (A) showing arterial CO2 tensions (PaCO2; y-axis) in mice exposed to 7.0% O2 and a range of inspired CO2 levels (% CO2; x-axis) was fit using linear regression (solid line, equation displayed on the graph). The dotted lines on the graph indicate the average baseline PaCO2 (horizontal) measured during exposure to room air, and the estimated inspired CO2 required to maintain this PaCO2 level (vertical) during exposure to 7% O2 based on the linear regression. Arterial blood samples from WT mice exposed to 7.0% O2, 3.2% CO2, balance N2, were analyzed to assess PaO2 (B), PaCO2 (C), and pHa (D). (E) Representative whole-body plethysmography traces from a WT mouse show the ventilatory response to 7.0% O2, 3.2% CO2, balance N2. Values are individual measurements (A) or means ± SE (B-D); n = 5–6 animals per group (B-D). *P < 0.05 vs. baseline (paired, two-tailed Student’s t-test).

