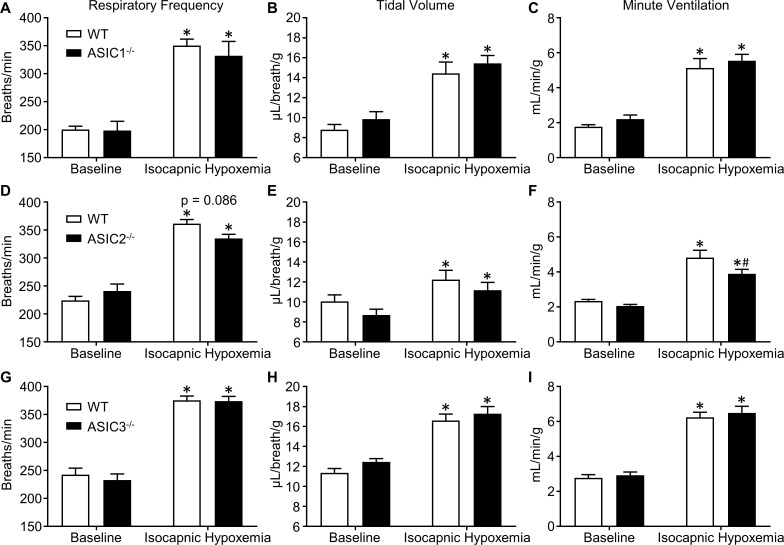
Fig 4. ASIC2, but not ASIC1 or ASIC3, contributes to the hypoxic ventilatory response.
Ventilatory responses to isocapnic hypoxemia (7.0% O2, 3.2% CO2, bal N2) were assessed using whole-body plethysmography and compared between (A-C) ASIC1-/-, (D-F) ASIC2-/-, and (G-I) ASIC3-/- and WT mice. Values are means ± SE; n = 8 (A-F) or 11–12 (G-I) animals/group. *P < 0.05 vs. baseline; #P < 0.05 vs. WT (2-way, repeated measures ANOVA; Sidak’s post-hoc test). Displayed P value corresponds to the comparison between WT and KO (panel D).

