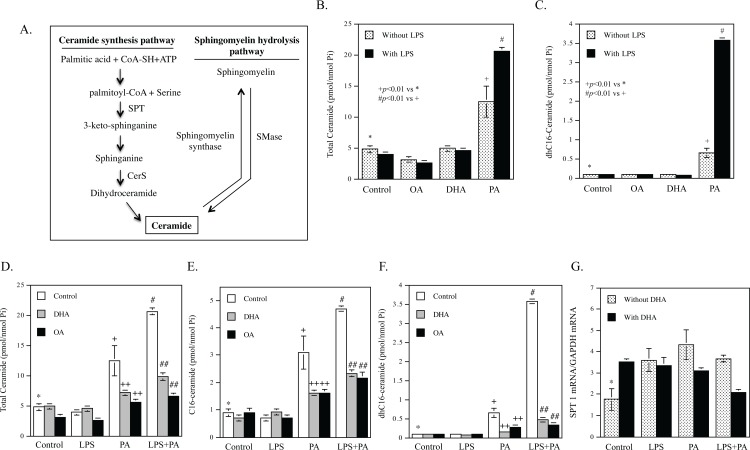
Fig 2. DHA inhibits the CER production increased by LPS and PA.
A. Diagram for CER de novo synthesis and sphingomyelin hydrolysis pathways. SPT, serine palmitoyltransferase; CerS, ceramide synthase; SMase, sphingomyelinase. B and C. LPS and PA synergistically stimulate total (B) and dhC16-CER production (C). RAW264.7 macrophages were treated with 100 μM of OA, DHA or PA in the absence or presence of 1 ng/ml of LPS for 12 h. After treatment, total and dhC16-CER were quantified using lipidomics. + vs. *, p<0.01; # vs. +, p<0.01. D-F. Either DHA or OA inhibited PA- or LPS plus PA-stimulated CER production. RAW264.7 macrophages were treated with 1 ng/ml LPS, 100 μM PA or both LPS and PA in the absence or presence of 100 μM DHA or OA for 12 h. After treatment, total CER (D), C16-CER (E) and dhC16-CER (F) were quantified using lipidomics. + vs. *, p<0.01; # vs. +, p<0.01; ++ vs. +, p<0.01; ## vs. #, p<0.01. G. DHA inhibits SPT1 mRNA expression stimulated by LPS and PA. RAW264.7 macrophages were treated with 1 ng/ml LPS, 100 μM PA or both LPS and PA in the absence or presence of 100 μM of DHA for 12 h. After treatment, SPT1 mRNA was quantified using real-time PCR. * vs. +, p<0.05; * vs. #, p<0.05; * vs. ^, p<0.05; ^^ vs. ^, p<0.01.

