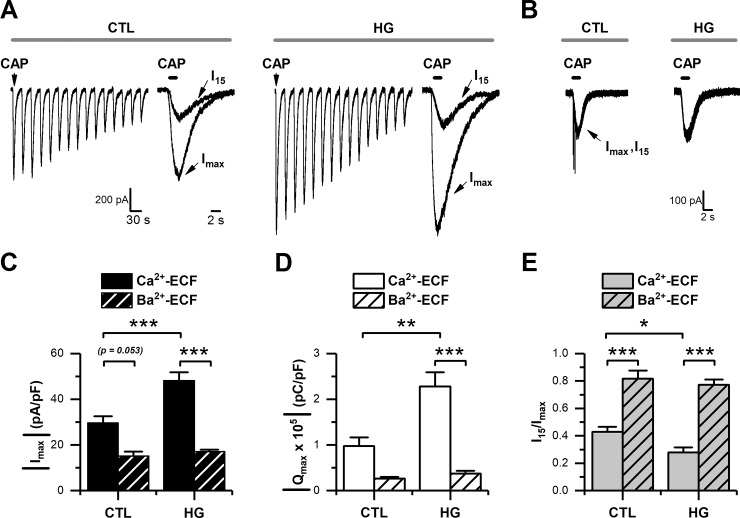
Fig 1. High glucose potentiated CAP-evoked currents in cultured DRG neurons.
A-B, representative traces of CAP-evoked currents recorded in whole-cell voltage-clamp mode (holding potential set at -60 mV). Agonist was applied for 1 s and repeated every 30 s, in control (CTL), and high glucose (HG) in Ca2+-ECF (A), and in the same glucose conditions but in Ba2+-ECF (B), respectively. C-E, bar graphs summarizing maximal current (Imax) density (C), maximal current charge (Qmax; D), and maximal current rundown calculated as the ratio of Imax relative to the 15th application (I15) in a series (E), for CTL (n = 24) and HG (n = 24) in Ca2+-ECF; and for CTL (n = 8) and HG (n = 11) in Ba2+-ECF, respectively. All data are represented as mean ± SEM. The absolute current density and charge were used in C and D for simplicity. Statistical analysis by two-way ANOVA followed by Sidak's post-hoc test. *, p < 0.05; **, p < 0.01; ***, p < 0.001.

