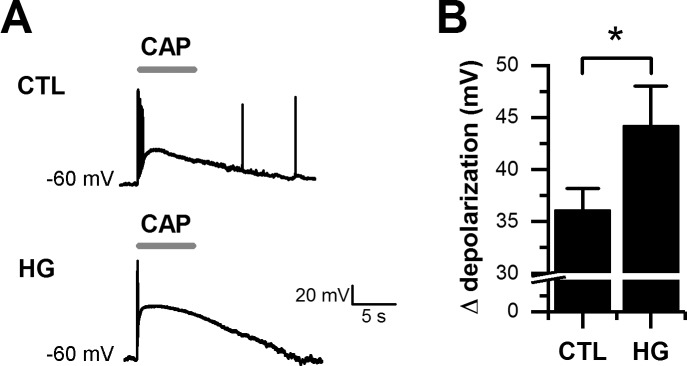
Fig 2. High glucose enhanced CAP-evoked depolarizations in cultured DRG neurons.
A, representative traces showing membrane depolarization induced in a single neuron from control (CTL, top trace) or high glucose (HG, bottom trace) condition by 5 s applications of CAP during whole-cell current clamp recordings. B, the bar graph summarizes the change in membrane potential evoked by the application of CAP. All data are represented as mean ± SEM, n = 8 for each condition. Statistical analysis by unpaired t-test; *, p < 0.05.

