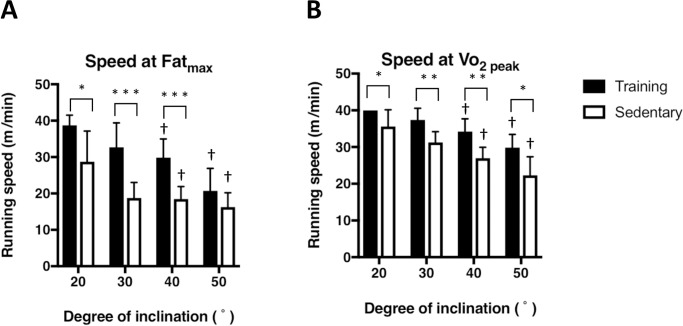
Fig 4.
Comparison between running speed at the exercise intensity that elicits maximum fat oxidation (Fatmax, A) and running speed at Vo2 peak (B). The running protocol was described in Fig 1. Values are mean ± SD (n = 6). *P < 0.05 compared as 0° of inclination. * P< 0.05, ** P<0.01, and *** P<0.001 between training and sedentary groups. † P < 0.05 compared to the corresponding value at 20°.

