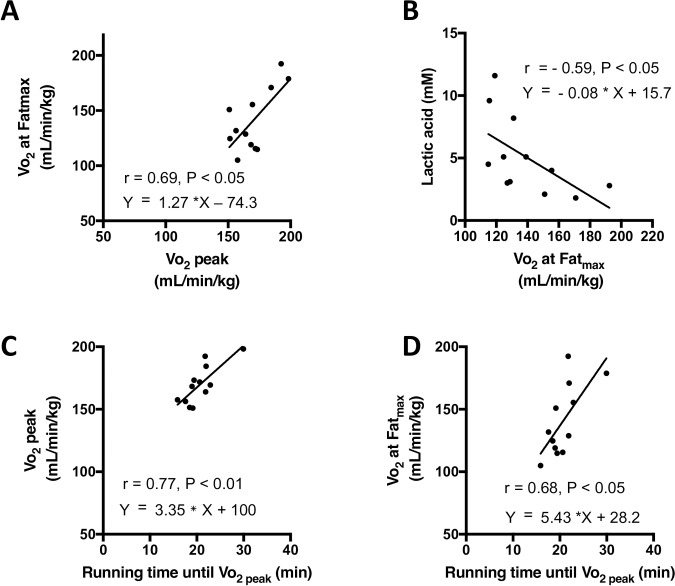
Fig 7. Correlations among Vo2 at Fatmax, Vo2 peak, running time until fatigue, and plasma lactic acid concentration during running at an inclination of 40°.
The running protocol was described in Fig 1. Linear correlations were analyzed between Vo2 peak and Vo2 at Fatmax (A), between Vo2 at Fatmax and plasma lactic acid concentration (B), between Vo2 peak and running time until Vo2 peak (C), and between Vo2 at Fatmax and running time until fatigue (D). Plasma lactic acid concentration was measured during running at a speed of 24 m/min at the inclination of 40° as described in Fig 6. The running protocol was described in Fig 1. Individual data are shown (n = 12).

