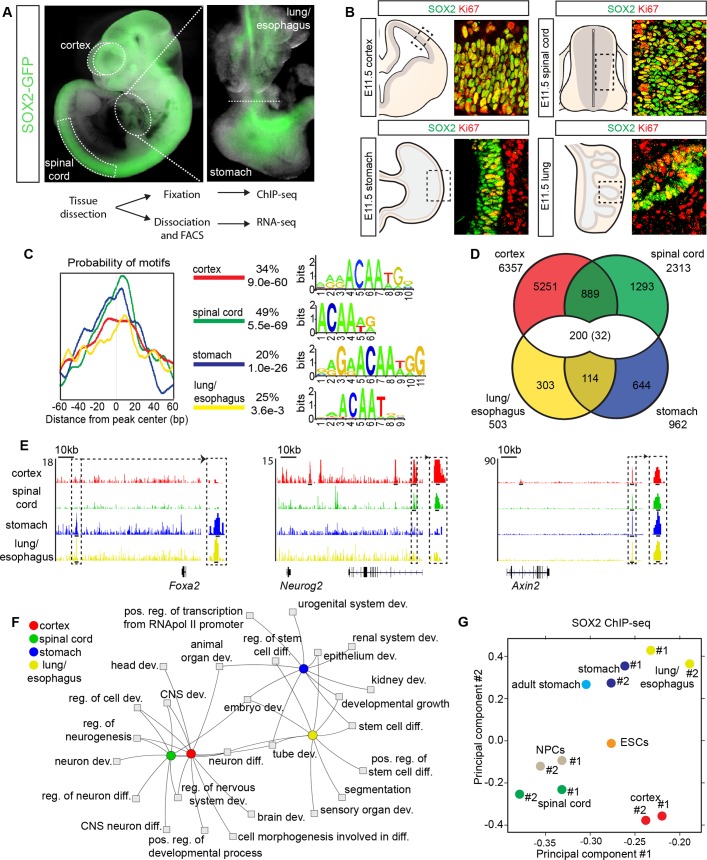
Fig 1. Cell-type-specific binding of SOX2 in CNS and endoderm progenitors.
(A) E11.5 Sox2-Gfp knock-in embryo shows expression in the cortex and spinal cord, while inset highlights expression in dissected stomach and lung/esophagus. (B) Overlapping expression of SOX2 and Ki67 in cycling progenitors of the E11.5 cortex, spinal cord, stomach and lung. Grey areas in diagrams represent SOX2+ stem cells, while tan surroundings in stomach and lung represent non-endodermal derived mesenchymal cells. (C) Central enrichment of SOX2 binding motifs in cortex, spinal cord, stomach and lung/esophagus SOX2 ChIP-seq peaks. The percentage of peaks that the given motifs are found centrally enriched, and their p-values are listed. (D) Venn diagram showing overlap between sites bound in the different SOX2 ChIP-seq experiments. 32 peaks overlapped in all four tissues. (E) Representative tracks showing germ-layer-specific and common SOX2 ChIP-seq reads aligned around Foxa2, Neurog2 and Axin2 gene loci, with magnification of selected peak sites. Tracks from cortex are in red, spinal cord in green, stomach in blue and lung/esophagus in yellow, with read scale maximum labelled on y-axis. Inset black lines are centred on peaks. (F) Toppcluster Fruchterman-Reingold Network of the top ten GO terms enriched for genes bound by SOX2 in the cortex, spinal cord, stomach and lung/esophagus. (G) Diffbind PCA of SOX2 ChIP-seq duplicates in cortex, spinal cord, stomach and lung/esophagus, as well as published SOX2 ChIP-seqs in ESCs, ESC derived NPCs and adult stomach.

