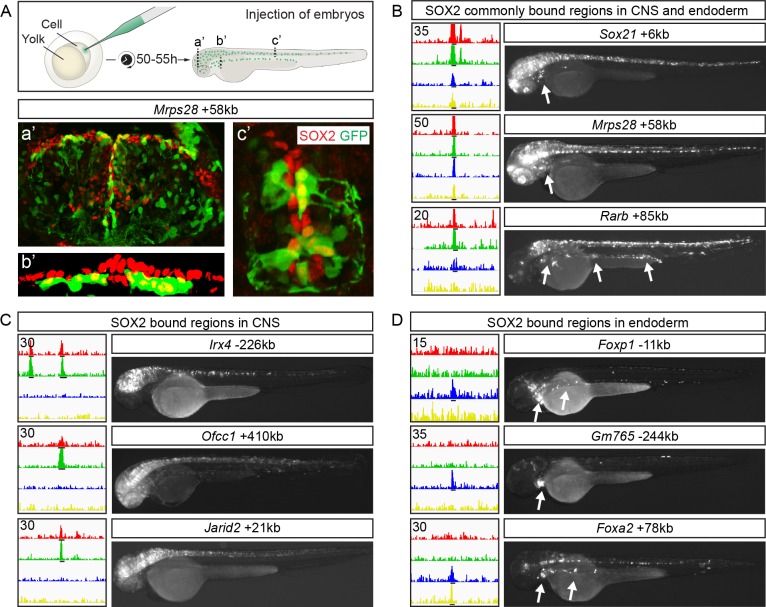
Fig 3. SOX2 bound CRMs possess cell-type-specific enhancer activity.
(A) Schematic of the zebrafish reporter system used to analyze enhancer expression. Sections of 50 hour post-fertilization zebrafish embryos from three different anterior-posterior levels (a’: midbrain, b’: pharyngesophageal endoderm, c’: spinal cord) following injection of the Mrps28+58kb enhancer. Expression of SOX is shown in red and GFP in green. (B-D) Three examples each of SOX2 ChIP-seq tracks with read scale maximum values inset top left (cortex in red, spinal cord in green, stomach in blue and lung/esophagus in yellow) and reporter expression from enhancers commonly (B) or specifically bound by SOX2 in CNS (C) and endoderm (D). Arrows point to GFP expression in endoderm. Black lines under tracks indicate called SOX2 peaks.

