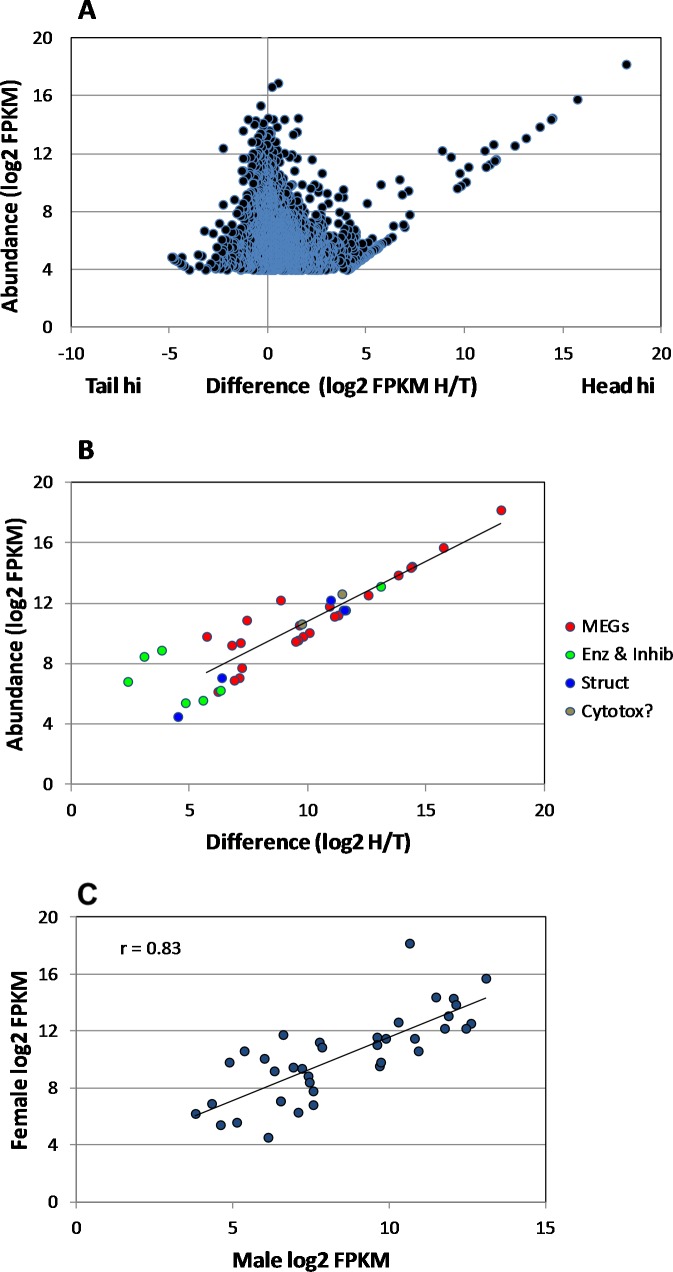
Fig 5. Head-enriched genes in female worms.
A) Scatter plot of differential gene expression in female heads and tails, based on the Trinity assembly of raw reads from HiSeq. Those genes differentially expressed >16-fold in the heads with a FPKM of >16 were considered for analysis. B) Differentially expressed genes encoding secreted or membrane proteins classified by category. C) A comparison of the expression level of selected genes in male and female heads. The correlation coefficient r between the two parameters = 0.83.

