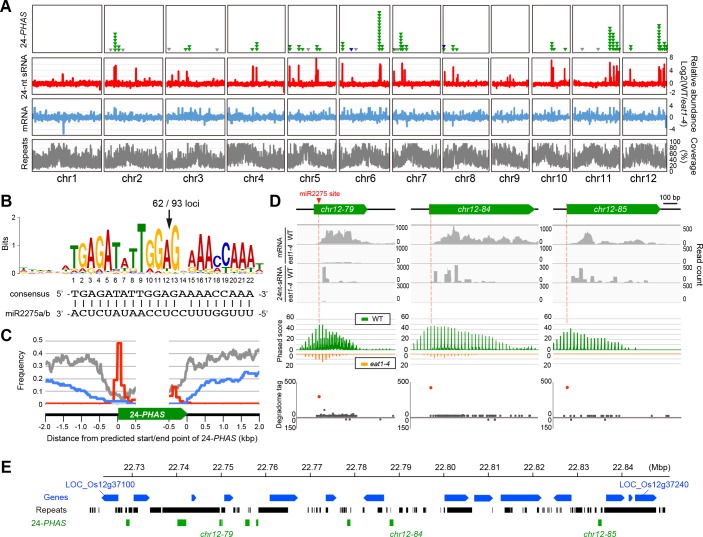
Fig 4. Characterization of 24-PHAS loci on rice genome.
(A) A genome-wide distribution of 24-PHAS loci. From top to bottom, the numbers of 24-PHAS loci (101 green triangles correspond to 24-PHAS loci showing an EAT1-dependent and ST.2-enriched expression, 9 gray triangles are previously reported 24-PHAS loci silent through ST.1 to ST.4 and 3 blue triangles are those showing EAT1-independent expression), the amounts of 24-nt sRNA-seq (red), mRNA-seq reads (blue) rated by subtraction of eat1-4 values from wild-type values (see Methods), and frequencies of repetitive sequences including TEs (gray charts). The horizontal length of each box corresponds to the physical distance of respective rice chromosomes. (B) A conserved sequence logo found in upstream of ninety-three 24-PHAS loci detected by MEME program [35], which are potentially targeted by miR2275. The arrow indicates the predicted cleaved position by DCL1 and miR2275 complex [10]. (C) Frequency of repetitive sequence (grey), gene coding region (blue) and miR2275 targeted site (red) around 24-PHAS loci. The data was examined in 93 24-PHAS transcripts with conserved miR2275 targeted sites. The reason why a small peak of miR2275 target site appeared at the 3’ end of 24-PHAS is that some 24-PHAS loci were relatively small in length (~ 500 bp). (D) Characterization of three 24-PHAS loci. From the top to the bottom, the graphs indicate the mapping results of mRNA-seq and 24-nt sRNA-seq reads (gray histograms), the 24-nt phasing pattern (green and orange charts), and the plot of read counts from the degradome-seq using young panicles of indica variety, 93–11 [38]. The degradome analysis revealed that the cleavage of three 24-PHAS transcripts frequently occurs at the position shown in (B), within the predicted miR2275 sites (red dots), while few degradome-seq reads were mapped onto both sense and antisense strands of other regions (gray dots). Reads were depicted by IGV [78]. (E) An example of distribution of EAT1-dependent 24-PHAS-loci cluster (green boxes) on the long arm of chromosome 12, with the context of surrounding genes (blue) and repetitive sequences (black).

