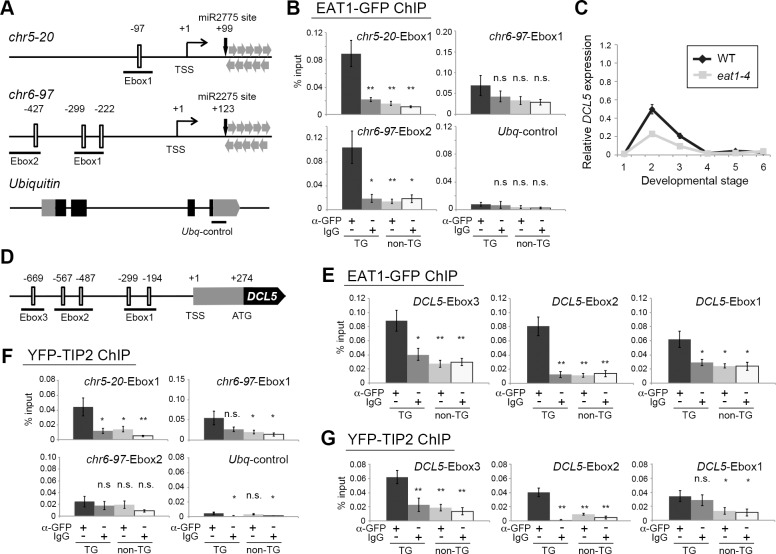
Fig 5. EAT1 and TIP2 bind E-box motifs upstream of 24-PHAS loci and DCL5 gene.
(A) Schematic illustrations of genomic compositions of the 5ʹ upstream regions of two 24-PHAS loci, chr5-20 and chr6-97, in addition to the coding region of the Ubiquitin gene as a negative control. Open boxes indicate the position of consensus E-box motifs. The number at the top of each motif shows a distance (bp) from the transcription start site (TSS). Regions underlined were used in the ChIP-qPCR assay. Grey and closed boxes in the Ubiquitin represent untranslated and coding regions, respectively. (B) ChIP-qPCR results of 24-PHAS promoters using transgenic (TG) plants expressing EAT1-GFP. IgG and non-TG plants were used as negative controls. n.s.; not significant. * and **; significant at P = 0.05 and P = 0.01 in Student's t-test, respectively, less than the leftmost positive ChIP result in each graph. (C) qRT-PCR results of DCL5 mRNA in wild-type and eat1-4 anthers. Relative expression values and standard errors were calculated by three biological replicates. The bottom numbers correspond to anther developmental stages in Table 1. (D) Genomic composition of the 5ʹ upstream region of the DCL5 gene. (E) ChIP-qPCR results of DCL5 promoters using TG plants expressing EAT1-GFP. (F) ChIP-qPCR results of 24-PHAS promoters using TG plants expressing YFP-TIP2. (G) ChIP-qPCR results of DCL5 promoters using TG plants expressing YFP-TIP2. In ChIP-qPCR analyses, relative abundance and standard errors were calculated by two or three biological replicates each subjected to three PCR replications.

