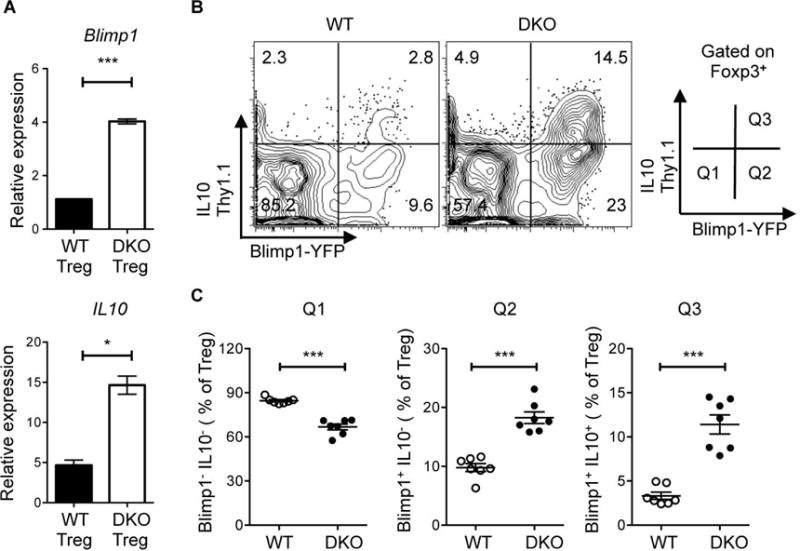
Figure 2. Upregulation of the Blimp1-IL10 axis in DKO Tregs.

A. Quantitative RT-PCR analysis of the expression of Blimp1 and IL10 mRNA in CD4+Foxp3+ (Treg) cells sorted from 8 wks and 24 wks old Foxp3-IRES-mRFP (FIR)-WT and FIR-DKO mice. Data are normalized relative to the expression of cyclophilin A and are representative of at least two independent experiments. B. Representative flow cytometric analysis and gating strategy of the expression of Blimp1 and IL10 on CD4+ Foxp3+ (Treg) cells in the spleen of WT and DKO Blimp1-YFP and IL10-Thy1.1 double-reporter mice. C. Percentage of WT and DKO Treg cells in Q1 (Blimp1−IL10−), Q2 (Blimp1+IL10−) and Q3 (Blimp1+IL10+). Data in B and C are pooled from at least three independent experiments, each with two to three mice per group. Each symbol represents an individual mouse (n=7). Error bars indicate the mean ± s.e.m., *P<0.05, **P<0.01, ***P<0.001 (unpaired, two-tailed Student’s t-test). ns, not significant.
