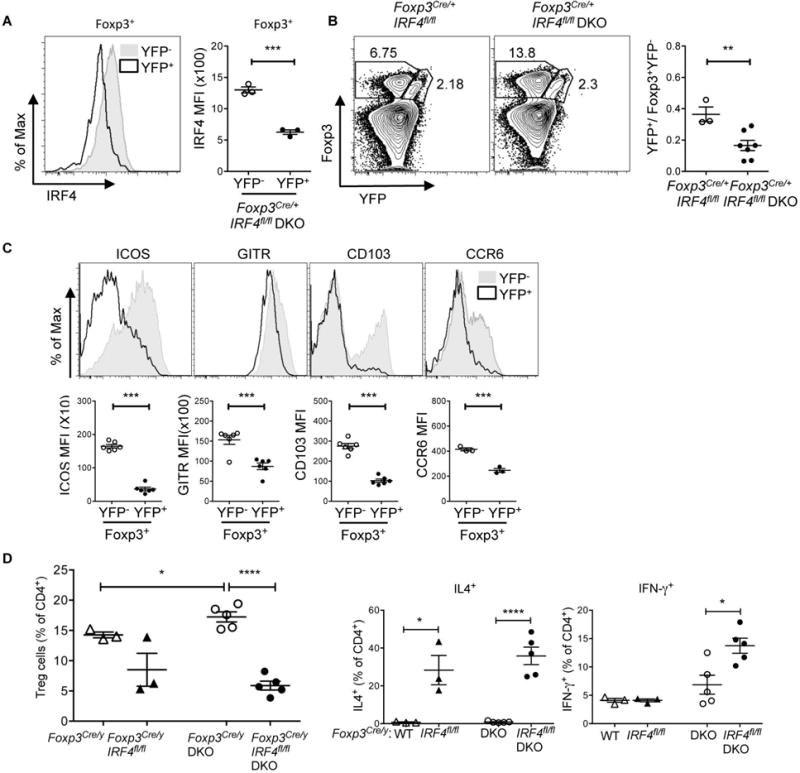
Figure 6. Expansion of DKO effector Tregs is dependent on IRF4.

A. Representative FACS histograms and MFI (right panel) of IRF4 on Foxp3+YFP− and Foxp3+YFP+ Treg cells in the spleen of 8 wks old Foxp3Cre/+ IRF4fl/fl DKO female mice. Data are representative of two independent experiments (n=3). B. Flow cytometry plots of Foxp3 and YFP on CD4+ T cells and ratios of Foxp3+YFP+ versus Foxp3+YFP− Treg cells in spleen of Foxp3Cre/+ IRF4fl/fl and Foxp3Cre/+ IRF4fl/fl DKO mice. Data are pooled from at least two independent experiments (n=3-7). C. FACS histograms and MFI of Treg cell-associated molecules (ICOS, GITR, CD103 and CCR6) on Foxp3+YFP− and Foxp3+YFP+ Treg cells in the spleens of Foxp3Cre/+ IRF4fl/fl DKO mice. Data are pooled from at least two independent experiments (n=3-6). C. Percentages of CD4+Foxp3+ (Treg) cells in the spleens of (5-12 wks old) Foxp3Cre/y, Foxp3Cre/y IRF4fl/fl, Foxp3Cre/y DKO and Foxp3Cre/y IRF4fl/fl DKO male mice. Data are pooled from at least three independent experiments (n=4-6). D. Percentages showing the intracellular expression of IL-4, and IFN-γ in splenocytes from the indicated mice. Data are pooled from at least two independent experiments (n=4-5). Each symbol represents an individual mouse. Error bars indicate the mean ± s.e.m., * P<0.05, **P<0.01, ***P<0.001 (unpaired, two-tailed Student’s t-test). ns, not significant.
