Figure 6.

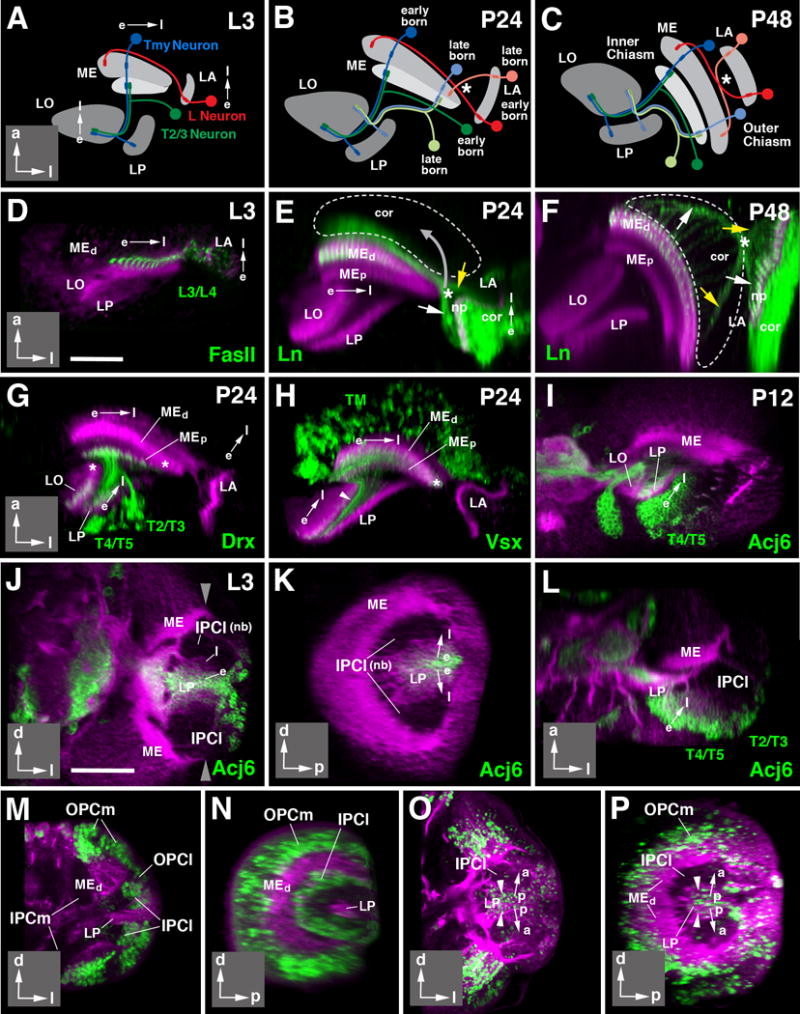
Directed growth and differentiation of the optic lobe. (A-C) Schematic horizontal sections of optic lobe of late larva (L3; A), 24h pupa (P24; B), and 48h pupa (P48; C). Neuropils are shaded in gray. Direction of growth in these and following panels is indicated by arrows (e early born; l late born). Insets at lower right corner of panels delineate orientation of panels (a anterior; d dorsal; l lateral; p posterior). Early born neurons are represented in saturated colors (lamina L neuron: red; medulla Tmy neuron: blue; medulla-lobula neuron (T2/T3): green); late born neurons of the same classes are shown in light colors in panels (B, C). (D-F): Directed differentiation of the lamina and distal medulla. Z-projections of horizontal confocal sections of the optic lobe at L3 (D), P24 (E), and P48 (F). Optic lobe neuropils in these and all following panels are labeled by anti-DNcadherin (magenta). Lamina projection neurons (L3/L4) are labeled by anti-Fasciclin II (FasII; green in D) or ln-Gal4>UAS-mCD8-GFP (green in E, F). Note that early born, more mature L3/4 axon terminals are thicker and show stronger GFP signal than later born immature terminals. Hatched lines in (E) and (F) outline boundaries of medulla cortex. White arrows in these panels point at early born L3/4 axons, yellow arrows at late born ones. Asterisk marks position where these axons cross. Note that position of crossing point moves as the lamina shifts forward and becomes oriented parallel to the medulla between P24 and P48 (movement indicated by gray arrow in E), resulting in formation of the outer optic chiasm (indicated by asterisk in F). (G-I) Directed differentiation of the proximal medulla and lobula/lobula plate. Panels show horizontal sections of optic lobes of 24h (P24) or 12h (P12) pupae. Discrete neuron populations are labeled by Drx-Gal4>UAS-mCD8-GFP (T2-T5 neurons, in G), Vsx-Gal4> UAS-mCD8-GFP (Tm neurons, in H), and acj6-Gal4> UAS-mCD8-GFP (T4/5 neurons in I). For all of these labeled neuron populations, terminal fibers are more pronounced in, or restricted to, the earlier born, more mature parts of the proximal medulla, lobula and lobula plate. Later formed, immature parts of these neuropils [asterisks in (G, H)] are devoid of fibers at P24. (I) and (J-L) show gradient in neuronal maturation in lobula plate cortex. T4/5 neurons, forming a major subpopulation of cells located in this cortex, show strong expression of the acj6 marker in posterior, more mature part of the cortex; expression decreases towards anteriorly. This gradient appears in the late larva, and reflects birth order of neurons, as shown in (J-L). The three panels represent frontal (J), sagittal (K) and horizontal (L) section of late larval (L3) optic lobe. Anti-DNcadherin (magenta) labels neuropil (strong label) and cell bodies/fibers (faint label). The C-shaped inner proliferation center [IPCl; unlabeled, consisting of dividing neuroblasts (nb)] buds off progeny towards the center. Earlier born cells are pushed centrally (away from the IPCl) by later born ones. Earlier born, more mature cells start expressing acj6; later born, less mature cells, closer to the IPCl (l) are acj6-negative. (M-P) demonstrate the directed growth in the IPCl using EdU incorporation. (M, N) represent frontal section (M) and sagittal section (N) of 76h larva pulsed with EdU over 4h prior to fixation. EdU label (green) is incorporated into the IPCl and the OPC. (O, P) present a frontal section (O) and sagittal section (P) of wandering third instar larva pulsed between 72and 76h, and chased to fixation at 100h. EdU-positive cells have vanished from the IPCl and are found in neural precursors, last divided between 72 and 76h, and now located in center of cell mass that becomes lobula plate cortex (LP). General label (magenta) of neurons (cortex, neuropils) by insc-Gal4; UAS-mCherry (M-N) or Jupiter::GFP (O-P). For other abbreviations, see legend of Fig.2. Bars: 25 μm (D-I); 50 μm (J-P)
