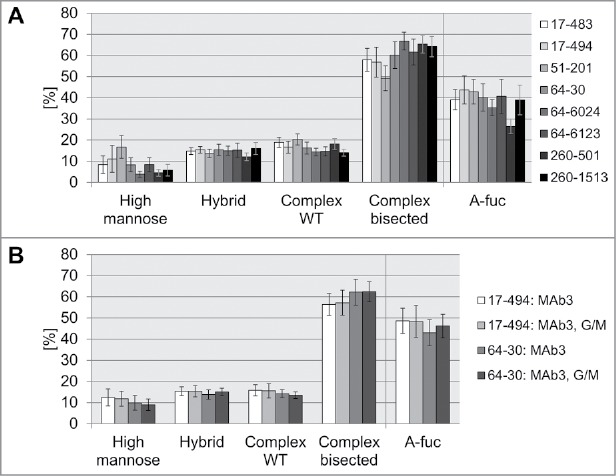
Figure 4.

Comparison of glycosylation pattern of antibodies produced in pre-glycoengineered host cell lines. A: Average glycan type distribution. Eight glyco-engineered host cell lines were stably transfected with mAb2 antibody genes. On average, antibody oligosaccharide structures from 49 clones per HCL were analyzed by MALDI-TOF MS and classified into high mannose, hybrid type, non-bisected complex (WT) or bisected complex type glycans. A-fuc, sum of a-fucosylated glycans. Error bars represent standard deviation according to the number of clones tested (as listed in Table 1). B: Stable transfection of HCL 17–494 or 64–30 with mAb3, or co-transfection with mAb3, GnT-III and Man-II (G/M). Glycan composition of 21 to 24 clones per transfection was analyzed by MALDI-TOF MS to calculate the average distribution and a-fucosylation rate. Error bars represent standard deviation according to the number of clones tested (as listed in Table 1).
