Figure 5.

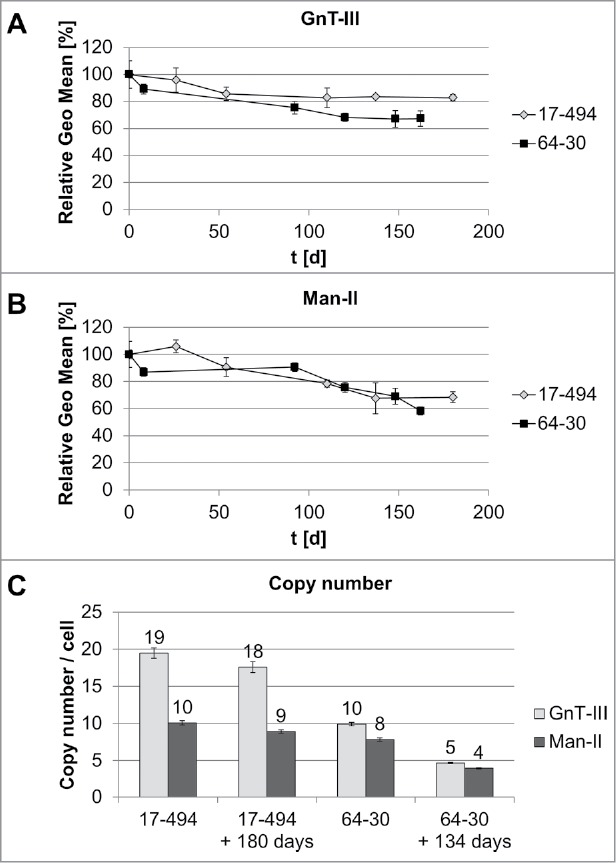
Characterization of transgene stability. A: GnT-III expression for each HCL was determined by flow cytometry after intracellular staining. Each time point was measured in triplicates. Relative GEO Mean: Geometric mean fluorescence intensity normalized to 100% at day zero. B: Man-II expression assessment by flow cytometry as described for GnT-III (A). C: Copy number determination at day zero and after 180 days (HCL 17–494) or 134 days (HCL 60–30) by qPCR. Error bars represent standard deviation.
