. 2018 Feb 23;7:e32127. doi: 10.7554/eLife.32127

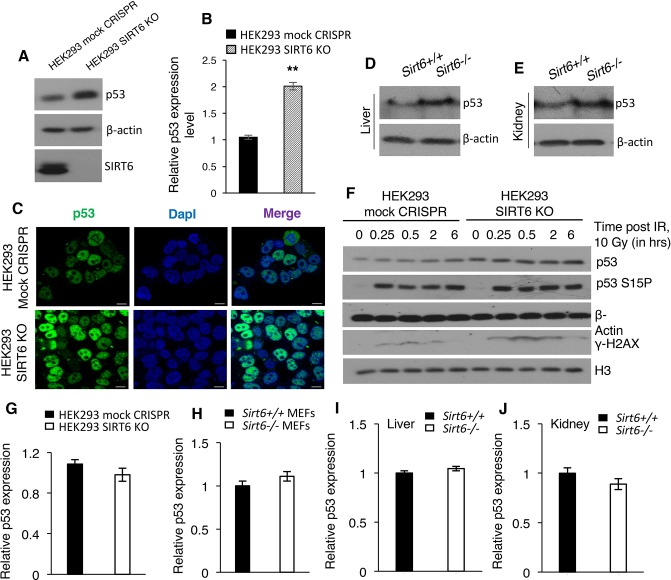
Figure 6. SIRT6 negatively regulates the stability of p53.

(A) Western blotting analysis of p53 protein expression in SIRT6 KO and control HEK293 cells. (B) Quantification of data presented in (A). Data represent mean ± SEM, n = 3. **p<0.01 calculated using Student’s t-test. (C) Immunofluorescence staining to confirm enhanced p53 expression in HEK293 mock CRISPR and SIRT6 KO cells. Scale bar, 10 µm. (D) Western blotting analysis of p53 protein expression in liver of wild-type (WT) and Sirt6-/- mice. (E) Western blotting analysis of p53 protein expression in kidneys of wild-type (WT) and Sirt6-/- mice. (F) Western blotting analysis of p53 and phosphorylation of p53 at serine 15 in HEK293 mock CRISPR and SIRT6 KO cells in response to 10 Gy of γ-irradiation. (G) qPCR analysis of p53 expression in HEK293 mock CRISPR and SIRT6 KO cells (with respect to Gapdh controls). Data represent mean ± SEM, n = 3. (H) qPCR analysis of p53 expression in Sirt6+/+ and Sirt6-/- MEFs (with respect to Gapdh controls). Data represent mean ± SEM, n = 3. (I) qPCR analysis of p53 expression in liver of Sirt6+/+ and Sirt6-/- mice (with respect to Gapdh controls). Data represent mean ± SEM, n = 3. (J) qPCR analysis of p53 expression in kidneys of Sirt6+/+ and Sirt6-/- mice (with respect to Gapdh controls). Data represent mean ± SEM, n = 3.

Figure 6.

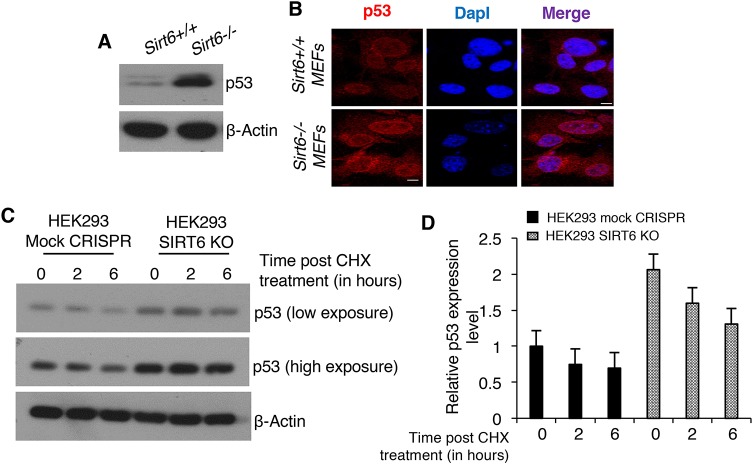
Figure 6—figure supplement 1. Analyses of the stability of p53 in the presence and absence of SIRT6.

Figure 6—figure supplement 1.

(A) Western blotting analysis of p53 protein expression in Sirt6+/+ and Sirt6-/- MEFs. (B) Immunofluorescence staining to confirm enhanced p53 protein expression in WT and Sirt6-/- MEFs. Scale bar, 10 µm. (C) Western blotting analysis of p53 levels in HEK293 mock CRISPR and SIRT6 KO cells after 6 hr of treatment with 150 µg/ml cycloheximide (CHX) to block protein synthesis. (D) Quantification of data presented in (C). Data represent mean ± SEM, n = 3.
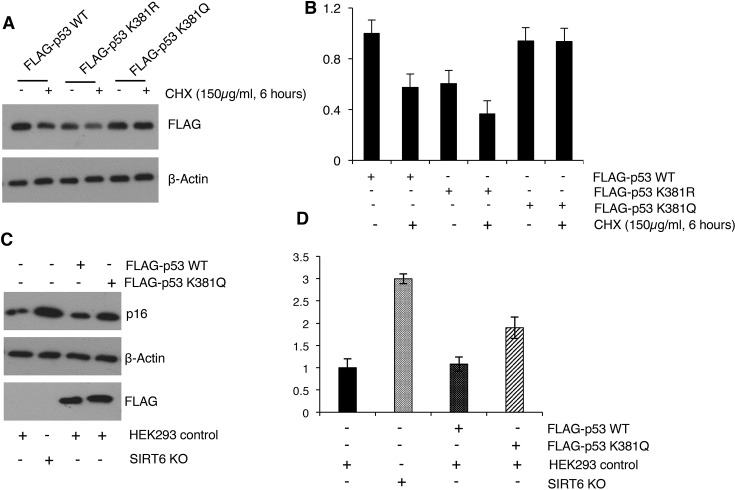
Figure 6—figure supplement 2. Acetyl mimic mutant p53 K381Q confers stability to p53 and imparts senescence-like properties to cells.

Figure 6—figure supplement 2.

(A) FLAG-tagged p53 wild-type (WT), lysine 381 to arginine (K381R, non-acetylatable) mutant, and lysine 381 to glutamine (K381Q, acetyl-mimic) mutants were ectopically expressed in HEK293 cells. Then western blotting analysis of p53 levels (using FLAG antibodies) was performed in cells after 6 hr of treatment with 150 µg/ml cycloheximide (CHX) to block protein synthesis. (B) Quantification of data presented in (A). Data represent mean ± SEM, n = 3. (C) FLAG-tagged p53 wild-type (WT) and lysine 381 to glutamine (K381Q, acetyl-mimic) mutant were ectopically expressed in HEK293 cells, keeping SIRT6 KO cells as control and whole cell lysate was collected post 48 hr of transfection. Then western blotting analysis was performed to determine p16 expression levels in the cells, with respect to corresponding β-actin controls. (D) Quantification of data presented in (C). Data represent mean ± SEM, n = 3.