
Figure 6.
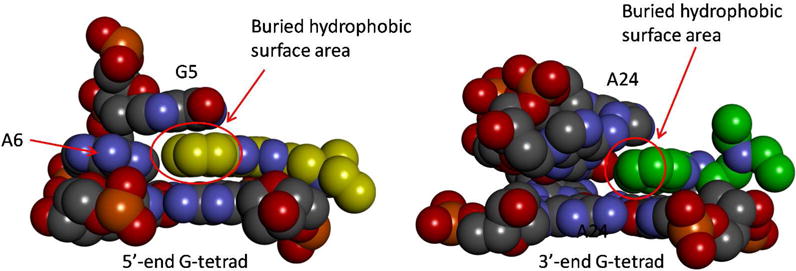
Detailed views of the 5′-end (left) and 3′-end (right) binding pockets. The carbon atoms in the two quindolines are displayed as yellow (left) and green (right) spheres. The red circles indicate the buried hydrophobic surface areas in each of the binding sites.