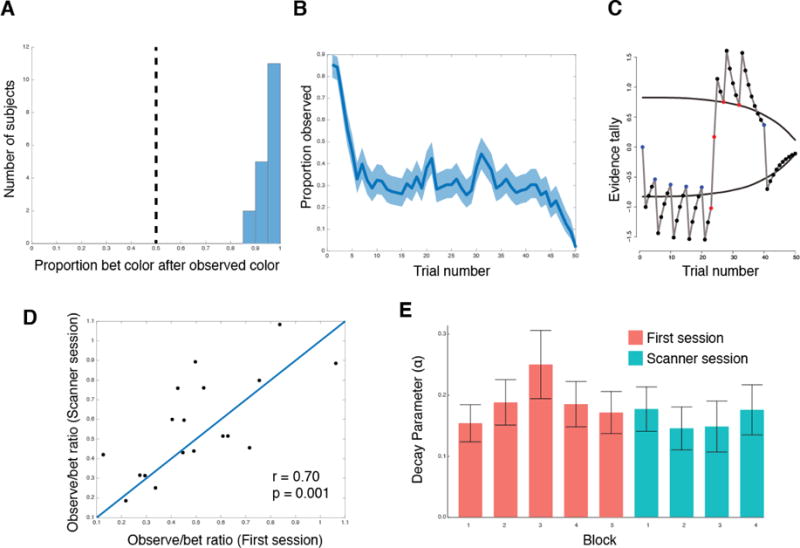
Figure 2. Behavior on the ‘observe or bet’ task. A).

Histogram showing the proportion of time each subject bet on the same color they observed on the previous trial. Vertical dashed line indicates random choice. B) Proportion of trials subjects observed by trial number on each block (averaged across all subjects). Shaded region indicated the 95% confidence interval. C) A visual representation of the model for one block. Circles indicate the action that was taken on that trial (black for bet, red for observed red, blue for observed blue). Grey line indicates the evidence tally on each trial. Black lines indicate the betting threshold. See Materials and Methods for model details. D) Observe to bet ratio for each subject for the initial behavioral session and the scanner session. Line indicates the point of equality for the two sessions. E) The average evidence decay parameter across all subjects for each block.
