
Figure 3. Comparison of total alcohol consumption and model predicted alcohol consumption of HAD-1 – LE – LAD-1 and P – LE – NP rats during 4 weeks of 24-hour alcohol availability sessions.
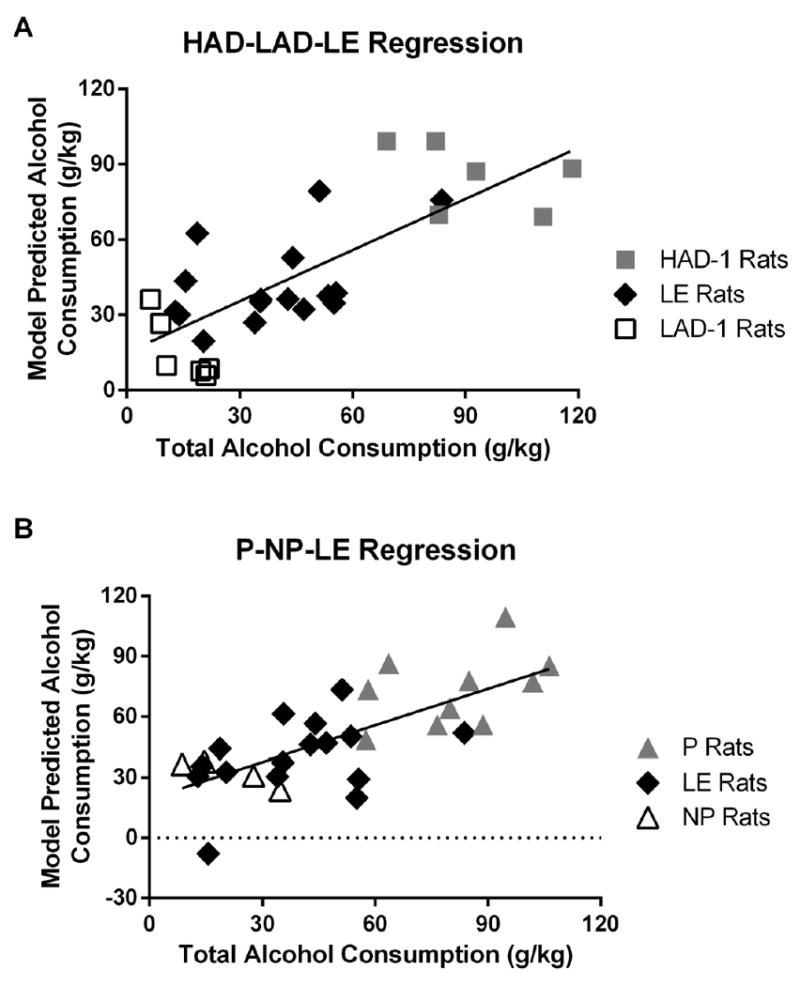
A) Multivariate linear regression models developed using linear discriminant scores from HAD-1, LE and LAD-1 rats showed a high degree of correlation between the model predicted alcohol consumption and the actual consumption of these rats (r squared = 0.5999, F1,26 = 38.99, p < 0.0001). B) Multivariate linear regression models developed using linear discriminant scores from P, LE and NP rats also showed a high degree of correlation between the model predicted alcohol consumption and the actual consumption of these rats (r squared = 0.5112, F1,28 = 29.29, p < 0.0001).