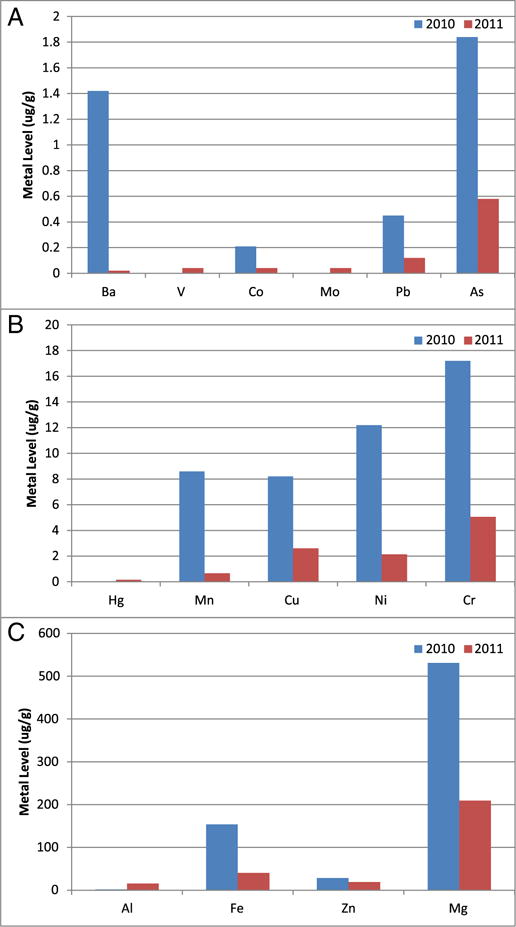
Fig. 5.

Metal concentrations in all pilot whales biopsied in the Gulf of Mexico. Sample sizes were 3 and 11 for 2011 and 2012 respectively. Data represented as mean ± standard deviation in units of μg/g tissue. Data are divided into panels solely for optimal visualization. (A) Metals with mean skin concentrations less than 2 μg/g; (B) metals with mean skin concentrations between 2 and 20 μg/g; (C) metals with mean skin concentrations greater than 20 μg/g.
