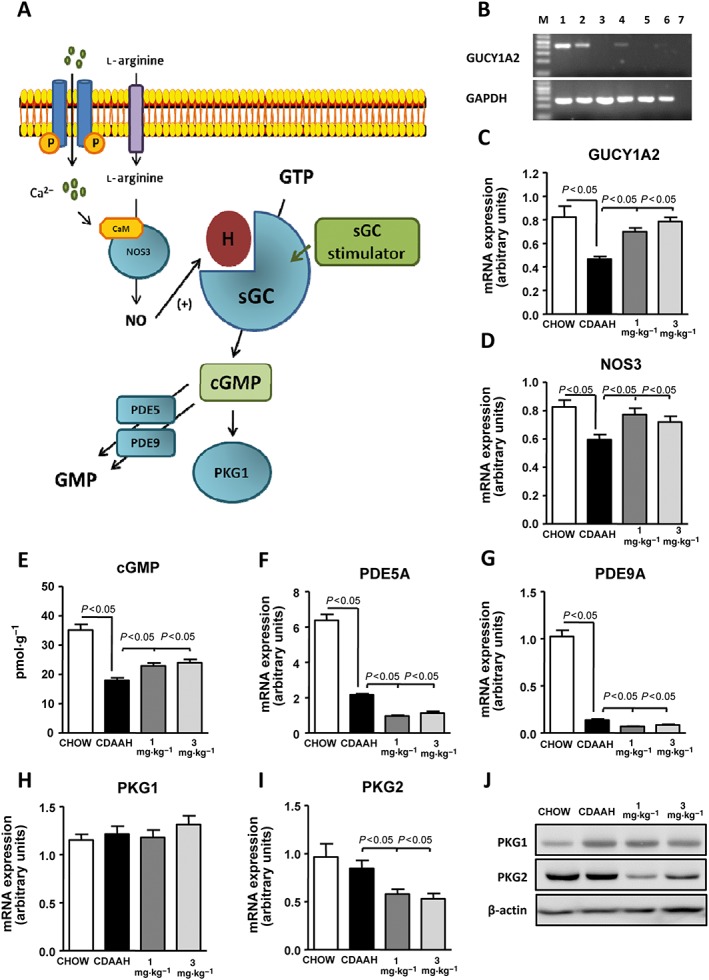
Figure 1.

Effects of IW‐1973 on the hepatic cGMP pathway. (A) Schematic diagram summarizing the cGMP signalling pathway and sGC stimulator site of action. CaM, Ca2+‐calmodulin; H, haem group. (B) Representative PCR analysis of GUCY1A2 and GAPDH expression in liver tissue (lane 2), hepatocytes (lane 3), quiescent HSC (lane 4), activated HSC (lane 5) and Kuppfer cells (lane 6). Lane 1 is a positive control (brain tissue), and lane 7 is a blank negative control. (C, D) GUCY1A2 and NOS3 mRNA expression determined by real‐time PCR in liver samples from mice receiving chow diet (n = 10), choline‐deficient, CDAAH diet (n = 15), CDAAH plus sGC stimulator IW‐1973 at 1 mg·kg−1 (n = 10) or CDAAH plus IW‐1973 at 3 mg·kg−1 (n = 10). (E) Hepatic cGMP levels determined by enzyme immunoassay. (F, G) Hepatic PDE5A and PDE9A mRNA expression determined by real‐time PCR. (H, I) Hepatic PKG1 and PKG2 mRNA expression. (J) Hepatic PKG1 and PKG2 protein expression. Results are expressed as mean ± SEM.
